一、Prometheus监控Nginx
1、监控Nginx相关插件下载地址
Nginx_module-vts下载地址 : https://github.com/vozlt/nginx-module-vts
nginx-release下载地址 : http://nginx.org/download/
Prometheus(8.3.3)和grafana(2.32.1)我使用的是官网最新版
2、编译Nginx
注意:我这边是使用rpm安装的Nginx。所以要进行编译一下,可以根据自己的实际情况进行操作
2.1 下载 nginx-release 并解压
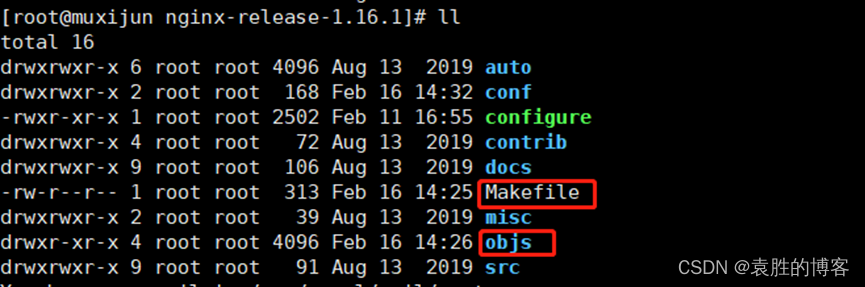
如果有这两个目录将其删除掉
|
1 |
rm -rf Makefile objs |
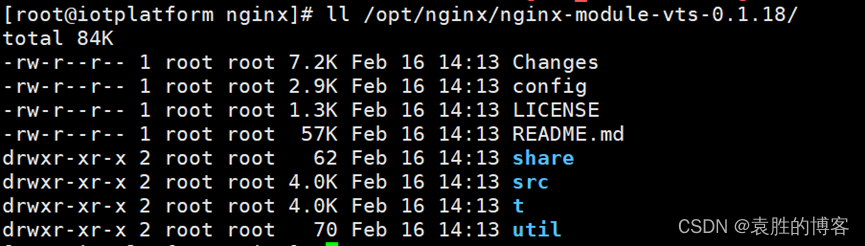
2.2 解压 Nginx-module-vts,到/opt/nginx/
2.3 执行以下命令,进行编译Nginx
|
1 |
./configure --prefix=/usr/share/nginx --sbin-path=/usr/sbin/nginx --modules-path=/usr/lib64/nginx/modules --conf-path=/etc/nginx/nginx.conf --error-log-path=/var/log/nginx/error.log --http-log-path=/var/log/nginx/access.log --http-client-body-temp-path=/var/lib/nginx/tmp/client_body --http-proxy-temp-path=/var/lib/nginx/tmp/proxy --http-fastcgi-temp-path=/var/lib/nginx/tmp/fastcgi --http-uwsgi-temp-path=/var/lib/nginx/tmp/uwsgi --http-scgi-temp-path=/var/lib/nginx/tmp/scgi --pid-path=/run/nginx.pid --lock-path=/run/lock/subsys/nginx --user=nginx --group=nginx --with-compat --with-debug --with-file-aio --with-http_addition_module --with-http_auth_request_module --with-http_dav_module --with-http_degradation_module --with-http_flv_module --with-http_gunzip_module --with-http_gzip_static_module --with-http_image_filter_module=dynamic --with-http_mp4_module --with-http_perl_module=dynamic --with-http_random_index_module --with-http_realip_module --with-http_secure_link_module --with-http_slice_module --with-http_ssl_module --with-http_stub_status_module --with-http_sub_module --with-http_v2_module --with-http_xslt_module=dynamic --with-mail=dynamic --with-mail_ssl_module --with-pcre --with-pcre-jit --with-stream=dynamic --with-stream_ssl_module --with-stream_ssl_preread_module --with-threads --with-cc-opt='-O2 -g -pipe -Wall -Wp,-D_FORTIFY_SOURCE=2 -fexceptions -fstack-protector-strong --param=ssp-buffer-size=4 -grecord-gcc-switches -specs=/usr/lib/rpm/redhat/redhat-hardened-cc1 -m64 -mtune=generic' --with-ld-opt='-Wl,-z,relro -specs=/usr/lib/rpm/redhat/redhat-hardened-ld -Wl,-E' --add-module=/opt/nginx/nginx-module-vts-0.1.18 |
2.4 再执行 make 命令
注意: 不要执行make install
|
1 |
make |
2.5 将编译后的二进制文件以及模块放到对应的目录下,并将原来的做备份
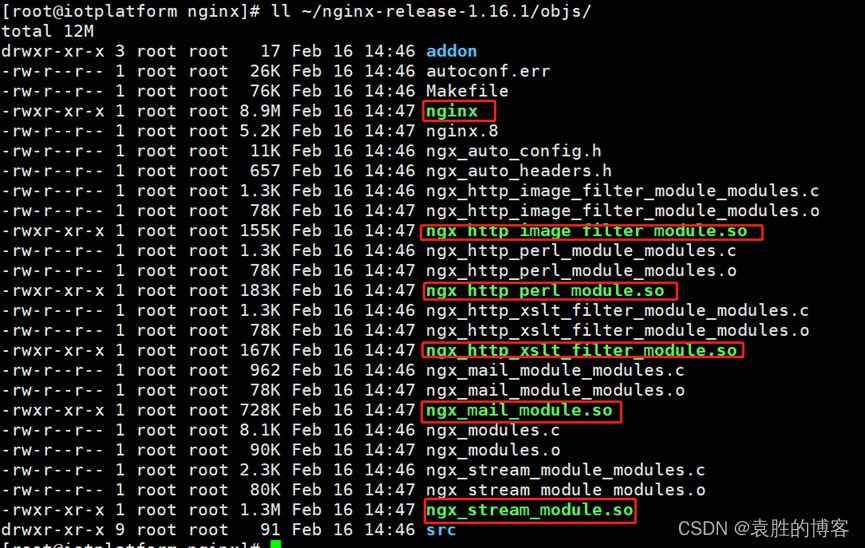
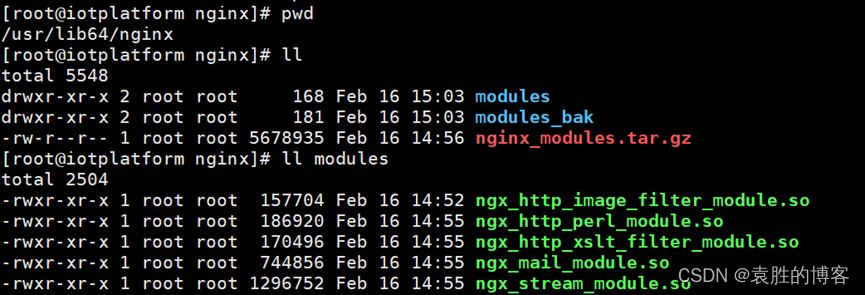

2.6 在Nginx 添加以下内容到Nginx配置文件中
|
1 2 3 4 |
location /status { vhost_traffic_status_display; vhost_traffic_status_display_format html; } |
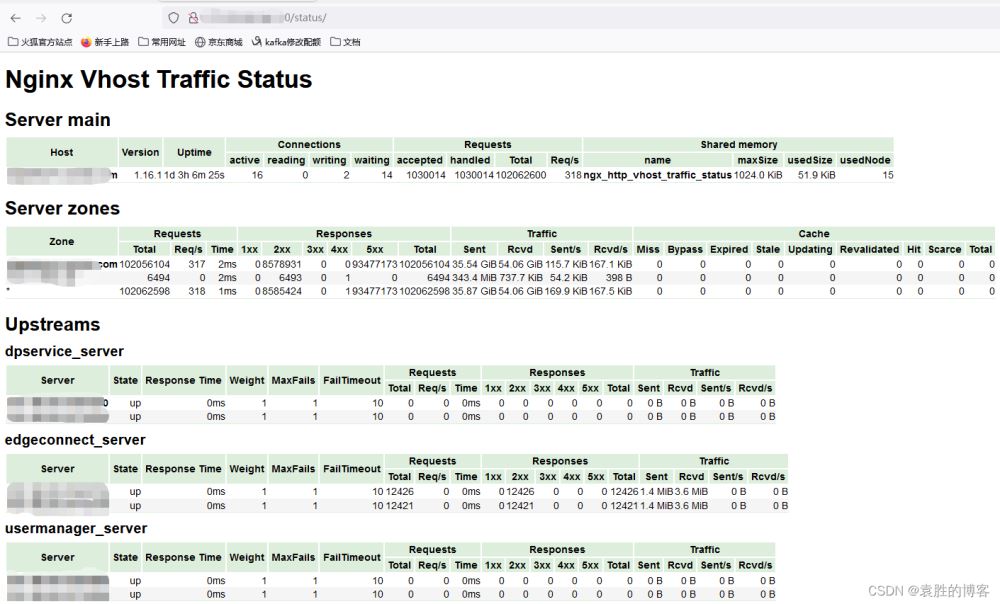
2.7 重新启动Nginx,并检查服务是否正常
http://127.0.0.1:80/status/
2.8 解压Nginx-vts-exporter,并启动

启动nginx-vts-exporter(默认端口为9913)
|
1 |
nohup ./nginx-vts-exporter -nginx.scrape_uri=http://127.0.0.1:80/status/format/json & |
2.9 在Prometheus中添加Nginx-vts-exporter,并重启Prometheus
|
1 2 3 4 |
vim promethues.yml - job_name: "nginx_exporter" static_configs: - targets: ["localhost:9913"] |
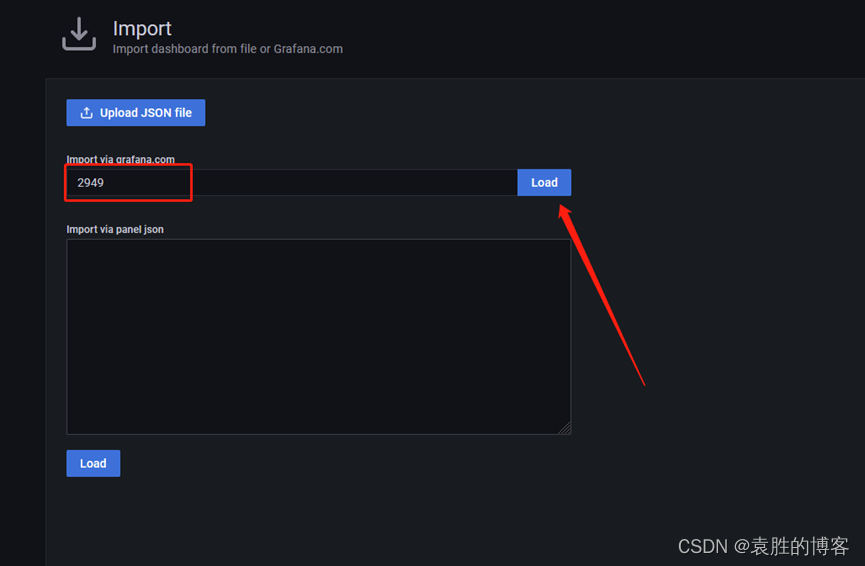
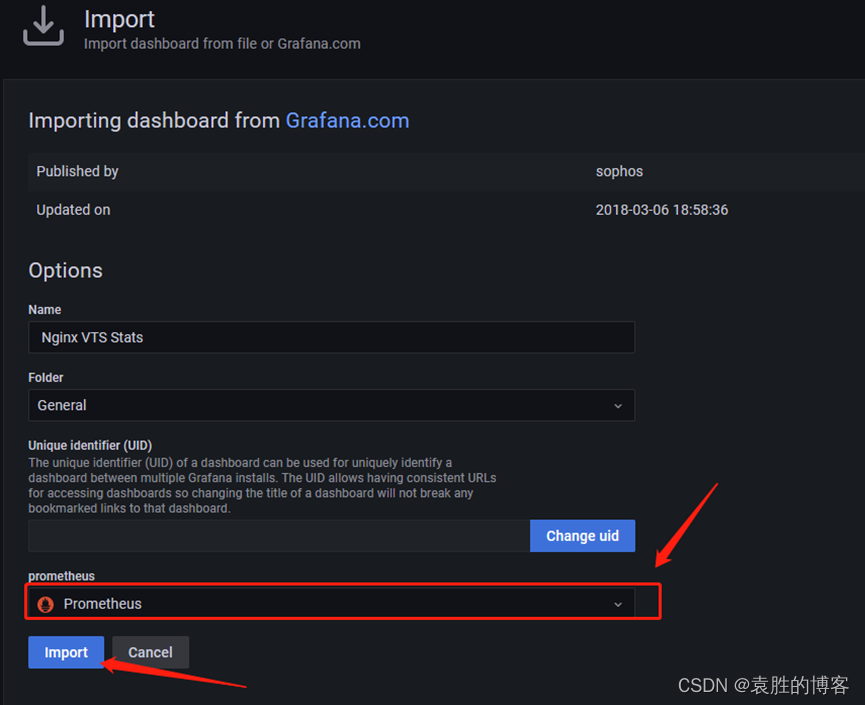
2.10 在grafana 中添加模块 使用的模块是2949,也可以自己定义
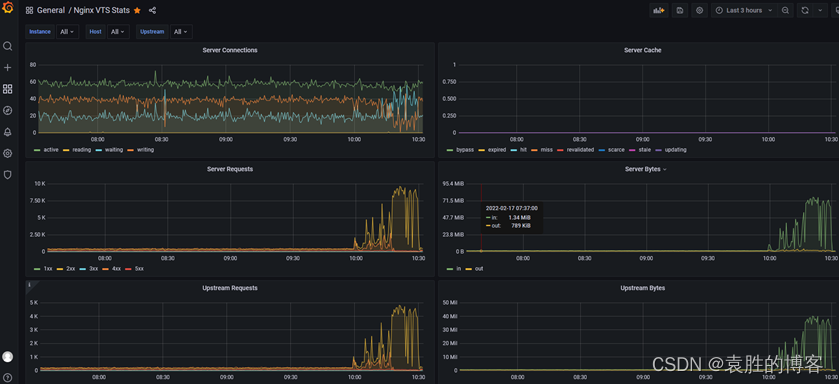
数据展示
二、Prometheus监控hbase
1. 监控hbase插件下载地址
jmx_prometheus_javaagent
grafana模块
2. 部署
2.1 将下载好的jmx_prometheus_javaagent 移动到hbase的lib下

2.2 配置 hbase_jmx_config.yaml
vim /usr/hbase/conf/ hbase_jmx_config.yaml
|
1 2 3 4 5 6 7 8 9 10 11 12 13 14 15 16 |
--- lowercaseOutputName: true lowercaseOutputLabelNames: true rules: - pattern: Hadoop name: HBase_metric_$4 labels: namespace: "$1" table: "$2" region: "$3" - pattern: Hadoop name: hadoop_$1_$4 labels: "name": "$2" "sub": "$3" - pattern: .+ |

2.3 在hbase-env.sh 中添加以下参数,并重启hbase
注意:分别在master和regionserver 都要添加,但是要注意端口不可以相同。(每台服务都做以上操作)
master
|
1 |
-javaagent:$HBASE_HOME/lib/jmx_prometheus_javaagent-0.16.1.jar=17000:$HBASE_HOME/conf/hbase_jmx_config.yaml |
regionserver
|
1 |
-javaagent:$HBASE_HOME/lib/jmx_prometheus_javaagent-0.16.1.jar=18000:$HBASE_HOME/conf/hbase_jmx_config.yaml |

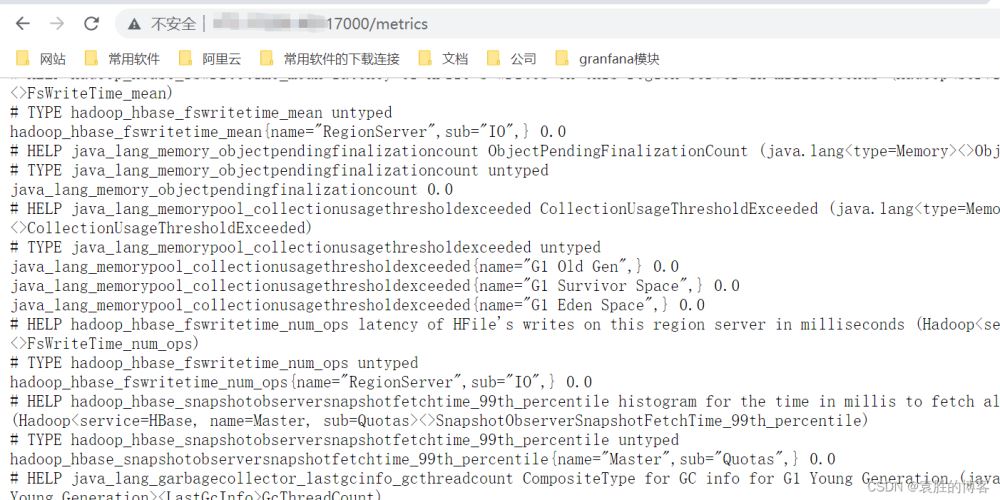
2.4 查看是否采集数据
http://127.0.0.1:17000/metrics
2.5 配置Prometheus server,并重启服务
IP地址根据实际情况改写
|
1 2 3 4 5 6 7 8 |
vim prometheus.yml - job_name: "hbase_exporter" static_configs: - targets: ["127.0.0.1:17000"] - targets: ["127.0.0.1:18000"] - targets: ["127.0.0.1:18000"] - targets: ["127.0.0.1:18000"] - targets: ["127.0.0.1:18000"] |
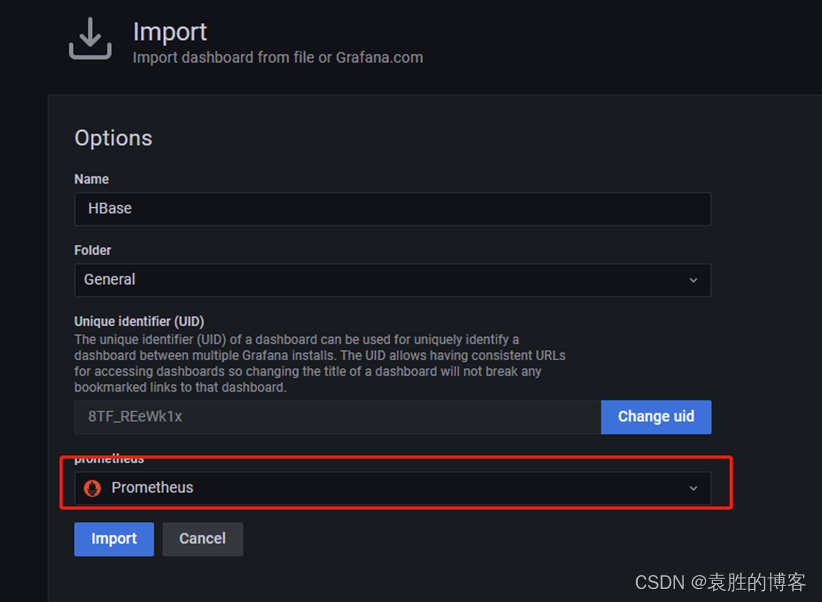
2.6 在granfan中添加模块
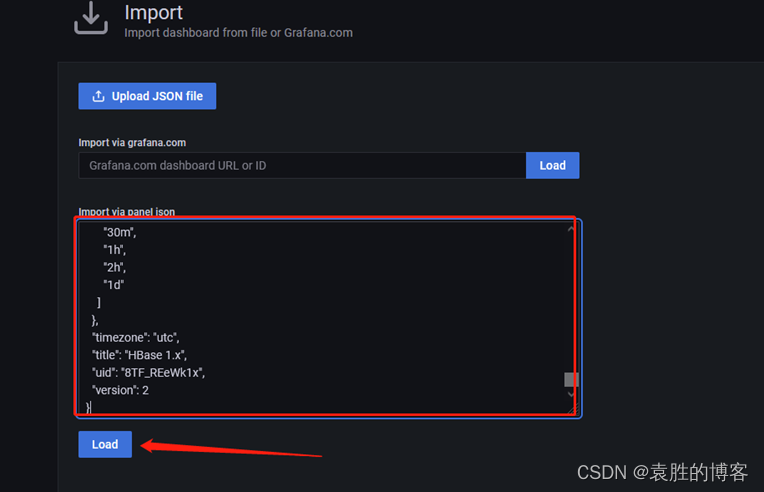
数据展示