oneR即“一条规则”。oneR算法根据已有的数据中,具有相同特征值的个体最可能属于哪个类别来进行分类。
以鸢尾data为例,该算法实现过程可解读为以下六步:
一、 导包与获取数据
以均值为阈值,将大于或等于阈值的特征标记为1,低于阈值的特征标记为0。
|
1 2 3 4 5 6 7 8 9 10 11 12 13 14 15 |
import numpy as np from sklearn.model_selection import train_test_split from sklearn.datasets import load_iris from collections import defaultdict from operator import itemgetter import warnings from sklearn.metrics import classification_report
# 加载内置iris数据,并保存 dataset = load_iris() X = dataset.data y = dataset.target
attribute_means = X.mean(axis=0) # 得到一个列表,列表元素个数为特征值个数,列表值为每个特征的均值 X_d = np.array(X >= attribute_means, dtype='int') # 转bool类型 |
数据到此已获取完毕,接下来将其划分为训练集和测试集。
二、划分为训练集和测试集
使用默认的0.25作为分割比例。即训练集:测试集=3:1。
|
1 |
X_train, X_test, y_train, y_test = train_test_split(X_d, y, random_state=random_state) |
数据描述:
本例中共有四个特征,
原数据集有150个样本,分割后训练集有112个数据,测试集有38个数据。
标签一共分为三类,取值可以是0,1,2。
三、定义函数:获取某特征值出现次数最多的类别及错误率
首先遍历特征的每一个取值,对于每一个特征值,统计它在各个类别中出现的次数。
定义一个函数,有以下四个参数:
- X, y_true即 训练集数据和标签
- feature是特征的索引值,可以是0,1,2,3。
- value是特征可以有的取值,这里为0,1。
该函数的意义在于,对于训练集数据,对于某个特征,依次遍历样本在该特征的真实取值,判断其是否等于特征的某个可以有的取值 (即value)(以0为例)。如果判定成功,则在字典class_counts中记录,以三个类别(0,1,2)中该样本对应的类别为键值,表示该类别出现的次数加一。
首先得到的字典(class_counts)形如:
{0: x1, 1.0: x2, 2.0:x3}
其中元素不一定是三个
x1:类别0中,某个特征feature的特征值为value(0或1)出现的次数
x2:类别0中,某个特征feature的特征值为value(0或1)出现的次数
x3:类别0中,某个特征feature的特征值为value(0或1)出现的次数
然后将class_counts按照值的大小排序,取出指定特征的特征值出现次数最多的类别:most_frequent_class。
该规则即为:该特征的该特征值出现在其出现次数最多的类别上是合理的,出现在其它类别上是错误的。
最后计算该规则的错误率:error
错误率即 具有该特征的个体在除出现次数最多的类别出现的次数,代表分类规则不适用的个体的数量。
最后返回待预测的个体类别 和 错误率
|
1 2 3 4 5 6 7 8 9 10 |
def train_feature_value(X, y_true, feature, value): class_counts = defaultdict(int) for sample, y_t in zip(X, y_true): if sample[feature] == value: class_counts[y_t] += 1 sorted_class_counts = sorted(class_counts.items(), key=itemgetter(1), reverse=True) # 降序 most_frequent_class = sorted_class_counts[0][0] error = sum([class_count for class_value, class_count in class_counts.items() if class_value != most_frequent_class]) return most_frequent_class, error |
返回值most_frequent_class是一个字典, error是一个数字
四、定义函数:获取每个特征值下出现次数最多的类别、错误率
|
1 2 3 4 5 6 7 8 9 10 11 12 13 |
def train(X, y_true, feature): n_samples, n_features = X.shape assert 0 <= feature < n_features # 获取样本中某特征所有可能的取值 values = set(X[:, feature]) predictors = dict() errors = [] for current_value in values: most_frequent_class, error = train_feature_value(X, y_true, feature, current_value) predictors[current_value] = most_frequent_class errors.append(error) total_error = sum(errors) return predictors, total_error |
因为most_frequent_class是一个字典,所以predictors是一个键为特征可以的取值(0和1),值为字典most_frequent_class的 字典。
total_error是一个数字,为每个特征值下的错误率的和。
五、调用函数,获取最佳特征值
|
1 2 3 4 5 6 7 8 9 |
all_predictors = {variable: train(X_train, y_train, variable) for variable in range(X_train.shape[1])} Errors = {variable: error for variable, (mapping, error) in all_predictors.items()} # 找到错误率最低的特征 best_variable, best_error = sorted(Errors.items(), key=itemgetter(1))[0] # 升序 print("The best model is based on feature {0} and has error {1:.2f}".format(best_variable, best_error)) # 找到最佳特征值,创建model模型 model = {'variable': best_variable, 'predictor': all_predictors[best_variable][0]} print(model) |
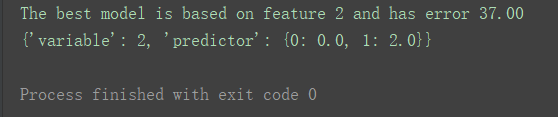
根据代码运行结果,最佳特征值是特征2(索引值为2的feature,即第三个特征)。
对于初学者这里的代码逻辑比较复杂,可以对变量进行逐个打印查看,阅读blog学习时要盯准字眼,细品其逻辑。
|
1 2 3 |
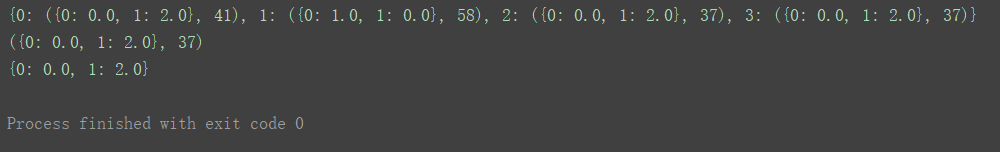
print(all_predictors) print(all_predictors[best_variable]) print(all_predictors[best_variable][0]) |
六、测试算法
定义预测函数,对测试集数据进行预测
|
1 2 3 4 5 6 7 8 9 |
def predict(X_test, model): variable = model['variable'] predictor = model['predictor'] y_predicted = np.array([predictor[int(sample[variable])] for sample in X_test]) return y_predicted
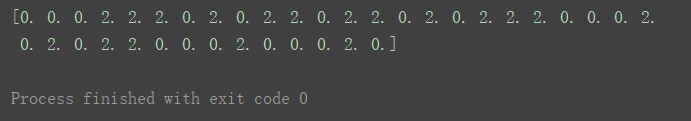
# 对测试集数据进行预测 y_predicted = predict(X_test, model) print(y_predicted) |
预测结果:
|
1 2 3 |
# 统计预测准确率 accuracy = np.mean(y_predicted == y_test) * 100 print("The test accuracy is {:.1f}%".format(accuracy)) |
根据打印结果,该模型预测的准确率可达65.8%,对于只有一条规则的oneR算法而言,结果是比较良好的。到此便实现了oneR算法的一次完整应用。
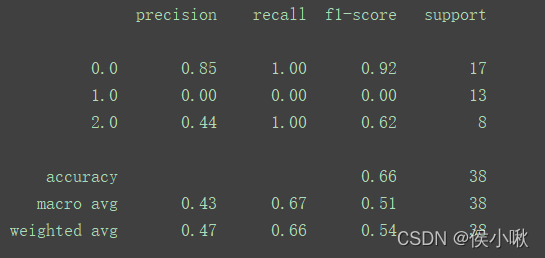
最后,还可以使用classification_report()方法,传入测试集的真实值和预测值,打印出模型评估报告。
|
1 2 3 4 |
# 屏蔽警告 warnings.filterwarnings("ignore") # 打印模型评估报告 print(classification_report(y_test, y_predicted)) # 参数为测试集的真实数据和预测数据 |