有时候因为jupyter notebook本身的主题不同,导致画图的时候与图表的颜色冲突,看不清坐标轴,这时候可以通过更换坐标轴风格来解决:
一、更换主题样式
|
1 |
plt.style.available |
|
1 2 3 4 5 6 7 8 9 10 11 12 13 14 15 16 17 18 19 20 21 22 23 24 25 26 27 |
## 主题如下: ['Solarize_Light2', '_classic_test_patch', 'bmh', 'classic', 'dark_background', 'fast', 'fivethirtyeight', 'ggplot', 'grayscale', 'seaborn', 'seaborn-bright', 'seaborn-colorblind', 'seaborn-dark', 'seaborn-dark-palette', 'seaborn-darkgrid', 'seaborn-deep', 'seaborn-muted', 'seaborn-notebook', 'seaborn-paper', 'seaborn-pastel', 'seaborn-poster', 'seaborn-talk', 'seaborn-ticks', 'seaborn-white', 'seaborn-whitegrid', 'tableau-colorblind10'] |
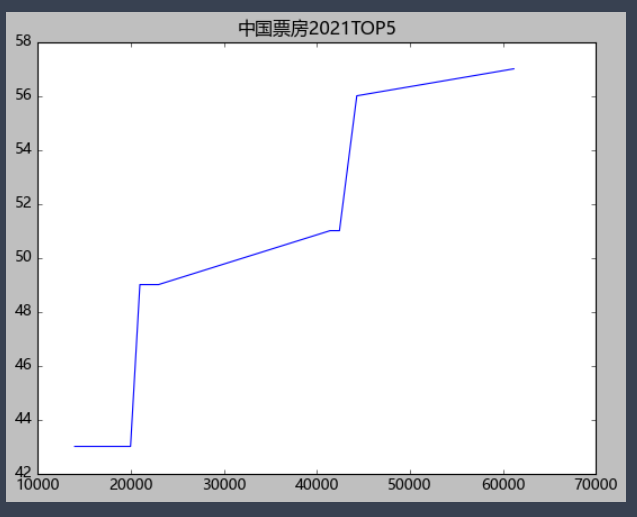
原始风格:
|
1 2 3 4 5 6 |
# 折线图进阶 from matplotlib import pyplot as plt plt.rcParams['font.sans-serif']=['Microsoft YaHei'] # 使用微软雅黑的字体 plt.title("中国票房2021TOP5") plt.plot(bo,prices,label='票房与票价') plt.show() |

更换主题:
|
1 |
plt.style.use('ggplot') |

|
1 |
plt.style.use('seaborn') |

|
1 |
plt.style.use('classic') |
最终我的效果:
|
1 2 3 4 5 6 7 8 9 10 11 |
# 折线图进阶 from matplotlib import pyplot as plt plt.rcParams['font.sans-serif']=['Microsoft YaHei'] # 使用微软雅黑的字体 plt.title("中国票房2021TOP5") plt.plot(bo,prices,label='票房与票价') plt.plot(bo,persons,label='票房与人次') plt.plot(bo,points,label='票房与评价') plt.legend() # 显示标签 plt.xlabel('票房') plt.ylabel('行情') plt.show() |

二、线条变换
'r^--' :红色虚线
'g^--' :绿色虚线
'b^--' :蓝色虚线
'g*-' :表示绿色,并且数据标记是一个星号
^:表示数据标记为一个向上的三角形
|
1 2 3 4 5 6 7 8 9 10 11 |
# 折线图进阶 from matplotlib import pyplot as plt plt.rcParams['font.sans-serif']=['Microsoft YaHei'] # 使用微软雅黑的字体 plt.title("中国票房2021TOP5") plt.plot(bo,prices,'r^--',label='票房与票价') plt.plot(bo,persons,label='票房与人次') plt.plot(bo,points,label='票房与评价') plt.legend() # 显示标签 plt.xlabel('票房') # 横坐标轴标题 plt.ylabel('行情') # 纵坐标轴标题 plt.show() |


|
1 2 3 4 5 6 7 8 9 10 11 |
# 折线图进阶 from matplotlib import pyplot as plt plt.rcParams['font.sans-serif']=['Microsoft YaHei'] # 使用微软雅黑的字体 plt.title("中国票房2021TOP5") plt.plot(bo,prices,'r^--',label='票房与票价') plt.plot(bo,persons,'g*-',label='票房与人次') plt.plot(bo,points,'bo--',label='票房与评价') plt.legend() # 显示标签 plt.xlabel('票房') # 横坐标轴标题 plt.ylabel('行情') # 纵坐标轴标题 plt.show() |

|
1 2 3 4 5 6 7 8 9 10 11 |
# 折线图进阶 from matplotlib import pyplot as plt plt.rcParams['font.sans-serif']=['Microsoft YaHei'] # 使用微软雅黑的字体 plt.title("中国票房2021TOP5") plt.plot(bo,prices,'r^--',label='票房与票价') plt.plot(bo,persons,'g*-',label='票房与人次') plt.plot(bo,points,color='blue',marker='o',markersize=10,label='票房与评价') plt.legend() # 显示标签 plt.xlabel('票房') # 横坐标轴标题 plt.ylabel('行情') # 纵坐标轴标题 plt.show() |

三、将图表保存成本地图片
|
1 |
plt.savefig("cnbotop5.png") |


四、添加辅助线
|
1 2 3 4 5 6 7 8 9 10 11 12 13 |
# 03 经典款式无辅助线 plt.style.use('classic') # 折线图进阶 from matplotlib import pyplot as plt plt.rcParams['font.sans-serif']=['Microsoft YaHei'] # 使用微软雅黑的字体 plt.title("中国票房2021TOP5") plt.plot(bo,prices,'r^--',label='票房与票价') plt.plot(bo,persons,'g*-',label='票房与人次') plt.plot(bo,points,color='blue',marker='o',markersize=10,label='票房与评价') plt.legend() # 显示标签 plt.xlabel('票房') # 横坐标轴标题 plt.ylabel('行情') # 纵坐标轴标题 plt.show() |

|
1 |
plt.grid() # 添加网格线 |

五、调整画图的大小和清晰度
|
1 |
plt.figure(figsize=(16,10),dpi=100) |

这里dpi就相当于清晰度,而figsize就是长度和宽度

六、使用动漫风格
|
1 2 3 4 5 6 7 8 9 10 11 12 13 14 15 16 |
# 05 使用特殊风格 from matplotlib import pyplot as plt plt.xkcd() plt.figure(figsize=(16,10),dpi=100) plt.rcParams['font.sans-serif']=['Microsoft YaHei'] # 使用微软雅黑的字体 plt.rcParams.update({'font.family': "Microsoft YaHei"}) plt.title("中国票房2021TOP5") plt.plot(bo,prices,'r^--',label='票房与票价') plt.plot(bo,persons,'g*-',label='票房与人次') plt.plot(bo,points,color='blue',marker='o',markersize=10,label='票房与评价') plt.legend() # 显示标签 plt.xlabel('票房') # 横坐标轴标题 plt.ylabel('行情') # 纵坐标轴标题 plt.grid() plt.savefig("cnbotop5_300.png") plt.show() |


调整长宽来进行图像的扁平化调整

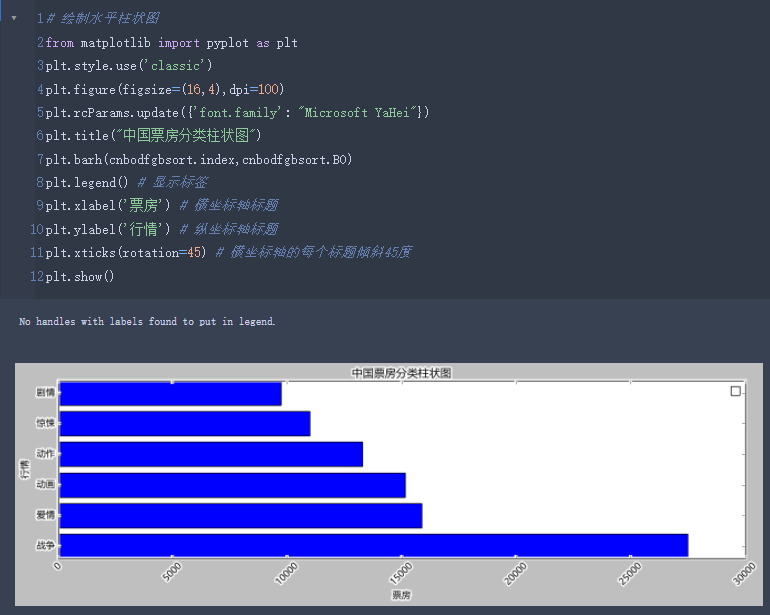
七、横坐标的倾斜度
|
1 |
plt.xticks(rotation=45) # 横坐标轴的每个标题倾斜45度 |
|
1 2 3 4 5 6 7 8 9 10 11 12 13 |
# 绘制水平柱状图 plt.style.use('classic') # cnbodfgbsort["BO"].to_list().reverse() # cnbodfgbsort.index.to_list().reverse() plt.figure(figsize=(16,10),dpi=100) plt.rcParams.update({'font.family': "Microsoft YaHei"}) plt.title("中国票房分类柱状图") plt.barh(rcnboindex,rbolist) plt.legend() # 显示标签 plt.xlabel('票房') # 横坐标轴标题 plt.ylabel('电影类型') # 纵坐标轴标题 plt.xticks(rotation=45) # 横坐标轴的每个标题倾斜45度 plt.show() |

八、横纵坐标轴转换
|
1 2 3 |
rbolist=cnbodfgbsort["BO"].to_list() rcnboindex=cnbodfgbsort.index.to_list() rbolist |
|
1 2 |
rbolist.reverse() rbolist |
|
1 |
rcnboindex.reverse() |