在数据可视化领域,创建交互式地图是一种强大的方式,可以使受众能够以引人入胜且信息丰富的方式探索地理数据。本文将深入探讨如何使用 Python 和 Pyecharts 库创建交互式上海地图。
Pyecharts 简介
Pyecharts 是一个基于 Python 的可视化库,它利用 ECharts 的强大功能,ECharts 是一个流行的 JavaScript 图表库。Pyecharts 允许开发人员使用 Python 创建各种交互式图表,包括地图、折线图、条形图等。
C:\pythoncode\new\output\PyechatChinaMap.py
创建上海地图
以下 Python 代码演示了如何使用 Pyecharts 创建交互式上海地图:
|
1 2 3 4 5 6 7 8 9 10 11 12 13 14 15 16 17 18 19 20 21 22 23 24 25 26 27 28 29 30 31 32 33 34 35 36 37 38 39 40 41 42 43 44 45 46 47 48 49 50 51 52 53 54 55 56 57 58 59 60 61 62 63 64 65 66 67 68 69 70 71 72 73 74 75 76 77 78 79 80 81 82 83 84 85 86 87 88 89 90 91 92 93 94 95 96 97 98 |
import wx import wx.html2 import os import time import logging from pyecharts import options as opts from pyecharts.charts import Map from pyecharts.globals import ThemeType import random
# 设置日志记录以调试问题 logging.basicConfig(level=logging.DEBUG, format='%(asctime)s - %(levelname)s - %(message)s')
class ChinaMapFrame(wx.Frame): def __init__(self, parent=None, title="中国地图展示"): # 设置框架为全屏大小 screen_width, screen_height = wx.GetDisplaySize() super().__init__(parent, title=title, size=(screen_width, screen_height))
# 创建一个垂直的sizer来管理布局 sizer = wx.BoxSizer(wx.VERTICAL)
# 创建WebView并将其添加到sizer,使其完全展开 self.browser = wx.html2.WebView.New(self) sizer.Add(self.browser, proportion=1, flag=wx.EXPAND | wx.ALL, border=0)
# 设置sizer和布局 self.SetSizer(sizer) self.Layout() self.Centre() self.Maximize(True) # 最大化以确保全屏 self.Show()
# 创建并加载中国地图 self.create_china_map()
def create_china_map(self): """创建上海地图并在WebView中显示""" logging.debug("开始创建上海地图")
# 上海示例数据(替换为您自己的实际数据) shanghai_districts = [ "黄浦区", "徐汇区", "长宁区", "静安区", "普陀区", "虹口区", "杨浦区", "闵行区", "宝山区", "嘉定区", "浦东新区", "金山区", "松江区", "青浦区", "奉贤区", "崇明区" ] shanghai_values = [random.randint(30, 120) for _ in range(len(shanghai_districts))] # 生成随机数据 shanghai_data = list(zip(shanghai_districts, shanghai_values))
map_chart = ( Map(init_opts=opts.InitOpts( width="100vw", height="100vh", theme=ThemeType.LIGHT, page_title="上海地图展示" )) .add("上海各区", shanghai_data, "上海", is_map_symbol_show=False, label_opts=opts.LabelOpts(is_show=True)) # 显示标签 .set_global_opts( title_opts=opts.TitleOpts(title="上海市行政区域图"), visualmap_opts=opts.VisualMapOpts( min_=0, max_=120, is_piecewise=True, range_color=["#50a3ba", "#eac763", "#d94e5d"], # 使用 range_color orient="vertical", pos_left="5%", pos_bottom="5%" ), toolbox_opts=opts.ToolboxOpts(), tooltip_opts=opts.TooltipOpts(trigger="item", formatter="{b}: {c}"), ) )
# 生成HTML文件 html_file = "shanghai_map.html" try: logging.debug(f"正在渲染上海地图到 {html_file}") map_chart.render(path=html_file) # 不要在此处传递模板或环境。Pyecharts将生成完整的HTML。 logging.debug(f"上海地图渲染成功到 {html_file}") except Exception as e: logging.error(f"渲染上海地图时出错:{e}", exc_info=True) return
# 在WebView中加载HTML文件 file_path = os.path.join(os.getcwd(), html_file) normalized_path = file_path.replace('\\', '/') file_url = f"file:///{normalized_path}" logging.debug(f"正在加载上海URL:{file_url}") self.browser.LoadURL(file_url)
def main(): app = wx.App(False) frame = ChinaMapFrame() app.MainLoop()
if __name__ == "__main__": main() |
代码说明
1.导入必要的库:该代码段导入了 wxPython(用于创建 GUI 窗口)、pyecharts(用于生成地图)、os(用于处理文件路径)和 logging(用于记录事件)等必要的库。
2.ChinaMapFrame 类:
- __init__ 方法创建一个带有 wx.html2.WebView 的 wx.Frame 窗口,用于显示交互式地图。
- create_china_map 方法使用 Pyecharts 生成上海地图。它首先定义上海各区的一些示例数据,然后使用这些数据创建一个 Map 对象。set_global_opts 方法用于配置地图的各种选项,例如标题、视觉映射和工具箱。最后,将地图渲染到 HTML 文件,并使用 WebView 加载该文件。
3.main 函数:该函数创建一个 wx.App 对象并启动主事件循环,从而显示地图窗口。
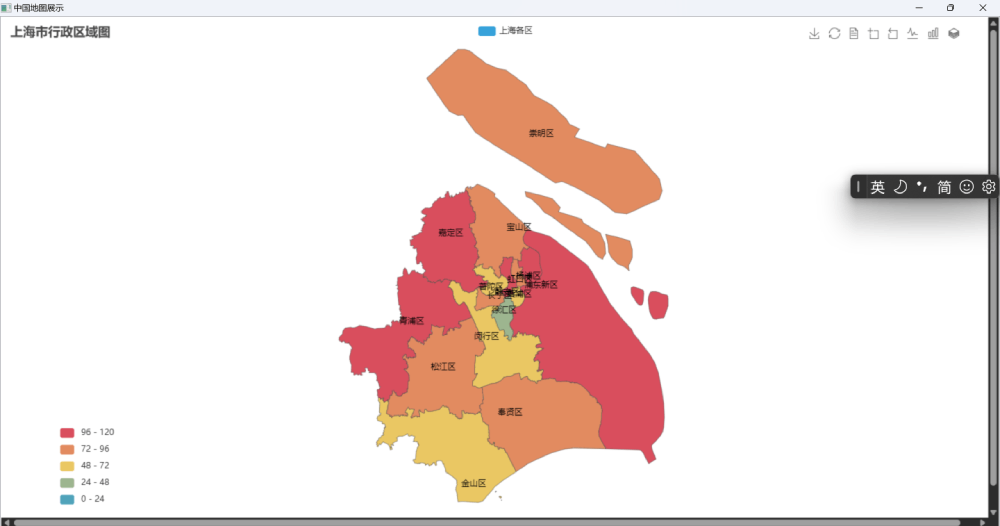
运行结果
总结
本文介绍了如何使用 Python 和 Pyecharts 创建交互式上海地图。Pyecharts 提供了各种各样的地图类型和配置选项,允许您创建满足特定需求的高度定制化的地图。通过将 Pyecharts 与 wxPython 等 GUI 库结合使用,您可以将交互式地图无缝集成到桌面应用程序中。