|
1
2
3
4
5
6
7
8
9
10
11
12
13
14
15
16
17
18
19
20
21
22
23
24
25
26
27
28
29
30
31
32
33
34
35
36
37
38
39
40
41
42
43
44
45
46
47
48
49
50
51
52
53
54
55
56
57
58
59
60
61
62
63
64
65
66
67
68
69
70
71
72
73
74
75
76
77
78
79
80
81
82
83
84
85
86
87
88
89
90
91
92
93
94
95
96
97
98
99
100
101
102
103
104
|
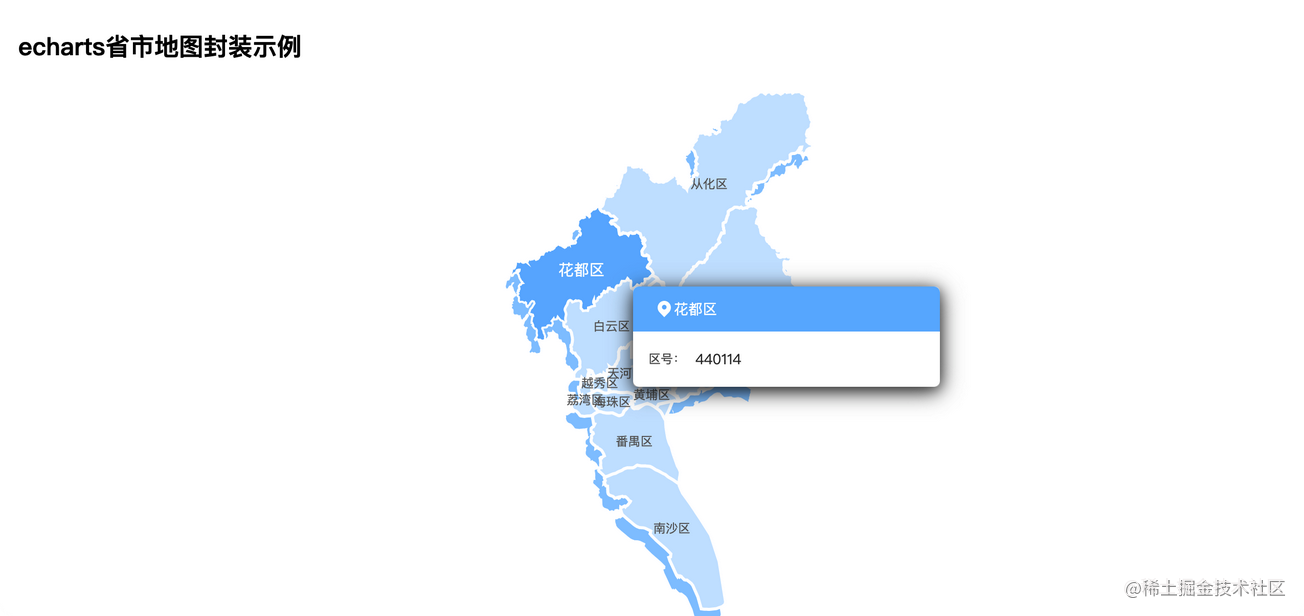
import * as echarts from 'echarts'
const getSimpleMap = (jsonMap, data, config) => {
if (!echarts.getMap(jsonMap.mark)) {
echarts.registerMap(jsonMap.mark, jsonMap.json)
}
const defaultConfig = {
tooltip: {
// 窗口外框
trigger: 'item',
padding: 0,
borderWidth: 0,
borderColor: '#FFFFFF',
backgroundColor: '#FFFFFF',
formatter: (params) => {
const { data } = params
const str = `<div style="width:300px;height: 98px;box-shadow: 0px 4px 20px 0px rgba(0, 0, 0, 0.8);
color: #fff;text-align:left;border-radius: 6px;">
<div style="background-color: rgba(102, 182, 255, 1);height: 44px;line-height: 44px;font-size:14px;font-weight:400;border-top-left-radius: 6px;border-top-right-radius: 6px;display: flex;align-items: center;">
<img style="width: 13px;height:16px;margin-left: 24px;margin-right: 3px;" src="images/map-ic.png">${data.name}
</div>
<div style="width: 100%;height:54px;display: flex;flex-wrap: wrap;">
<div style="display: flex;justify-content: space-between;width: 100%;padding-left:15px;padding-right: 15px;">
<div style="display:flex;align-items:center;width:132px;">
<div style="font-size: 12px;color: #555555;margin-right:10px;">区号:</div>
<div style="font-size: 14px;color: #333333;">${data.hoverObj == null ? '' : data.hoverObj.adcode}</div>
</div>
</div>
</div>
</div>`
return str
}
},
geo: {
map: jsonMap.mark,
type: 'map',
layoutCenter: ['50%', '50%'],
layoutSize: '150%',
zoom: 0.65,
roam: false,
itemStyle: {
normal: {
areaColor: 'rgba(201, 229, 255, 1)',
shadowColor: 'rgba(142, 201, 255, 1)',
shadowOffsetX: -5,
shadowOffsetY: 12
}
}
},
series: [
{
type: 'map',
map: jsonMap.mark, // 自定义扩展图表类型
zoom: 0.65, // 缩放
animationDuration: 1200,
itemStyle: {
// 地图样式
normal: {
borderColor: '#FFFFFF',
borderWidth: 3,
areaColor: 'rgba(201, 229, 255, 1)'
}
},
label: {
show: true,
color: '#666666',
fontSize: 12,
fontWeight: 400
},
emphasis: {
// 鼠标移入动态的时候显示的默认样式
label: {
show: true,
color: '#FFFFFF',
fontSize: 15,
fontWeight: 600
},
itemStyle: {
areaColor: 'rgba(102, 182, 255, 1)',
borderColor: '#FFFFFF',
borderWidth: 2
}
},
layoutCenter: ['50%', '50%'],
layoutSize: '150%',
data: data
}
]
}
const opt = Object.assign({}, defaultConfig, config)
const { legend, tooltip, series, geo, grid } = opt
const chartOpt = {
grid,
legend,
tooltip,
geo,
series
}
return chartOpt
}
export default {
getSimpleMap
}
|