解决方案网上有很多,尝试以后依然bug,这里先做一个记录,有时间再来处理。
错误报告如下:
OpenCV Error: Unspecified error (The function is not implemented. Rebuild the library with Windows, GTK+ 2.x or Carbon support. If you are on Ubuntu or Debian, install libgtk2.0-dev and pkg-config, then re-run cmake or configure script) in cvShowImage, file -------src-dir-------/opencv-2.4.10/modules/highgui/src/window.cpp, line 501
Traceback (most recent call last):
File "test.py", line 20, in <module>
cv2.imshow('img',img)
cv2.error: -------src-dir-------/opencv-2.4.10/modules/highgui/src/window.cpp:501: error: (-2) The function is not implemented. Rebuild the library with Windows, GTK+ 2.x or Carbon support. If you are on Ubuntu or Debian, install libgtk2.0-dev and pkg-config, then re-run cmake or configure script in function cvShowImage
这里我们切换另一种解决方案,利用python的matplotlib库完成图像的输出以及鼠标事件的添加。
点击图片,在图像中鼠标对应位置画点:
?
|
1
2
3
4
5
6
7
8
9
10
11
12
13
14
15
16
17
18
19
20
21
22
23
24
25
|
from matplotlib import pyplot as plt
import cv2
def on_press(event):
if event.inaxes == None:
print "none"
return
ax.scatter(event.xdata, event.ydata)
fig.canvas.draw()
if __name__ == "__main__":
fileN = r'./0107_1.3.6.1.4.1.14519.5.2.1.6279.6001.263660956768649083933159084365.bmp'
img = cv2.imread(fileN)
cv2.imshow('img',img)
fig = py.figure()
fig.canvas.mpl_connect("button_press_event", on_press)
ax = fig.add_subplot(121)
ax1 = fig.add_subplot(122)
ax.imshow(img)
ax1.imshow(img)
plt.axis("off")
plt.show()
|
先来简单解释一下代码的含义:
?
|
1
2
3
4
5
|
fig.canvas.mpl_connect("button_press_event", on_press)
def on_press(event):
event.inaxes.figure.canvas.draw()
event.x
event.xdata,event.ydata
|
最后的输出结果入下图。我们得到了非常奇怪的结果,如果你自己亲自动手试的话体会应该会更有体会,两边的图像本来应该一样大,但在第一次绘制点的时候,左侧图像出现了闪动,然后尺寸的比例突然发生了变化。
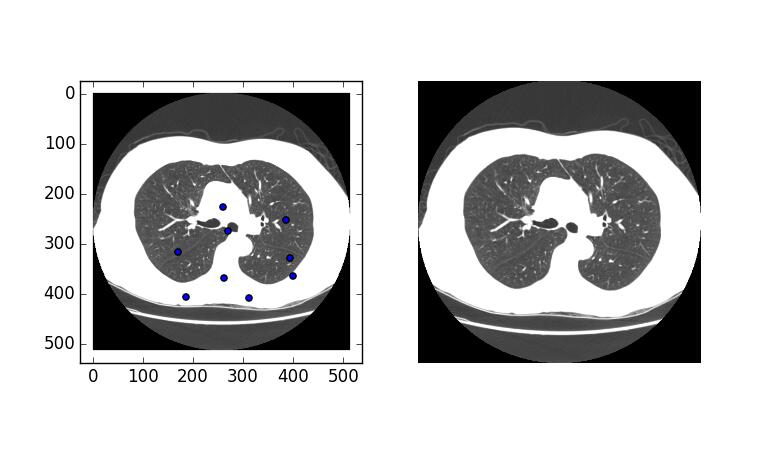
是的,图像尺寸没有发生变化,但尺寸的比例的确变了,这里我们要做的就是关闭自动变化的尺度比例。
?
|
1
2
3
4
5
6
7
8
9
10
11
12
13
14
|
if __name__ == "__main__":
fileN = r'./0107_1.3.6.1.4.1.14519.5.2.1.6279.6001.263660956768649083933159084365.bmp'
img = cv2.imread(fileN)
cv2.imshow('img',img)
fig = py.figure()
fig.canvas.mpl_connect("button_press_event", on_press)
ax = fig.add_subplot(121)
ax1 = fig.add_subplot(122)
ax.imshow(img)
ax1.imshow(img)
ax.set_autoscale_on(False)
plt.axis("off")
plt.show()
|
当然,我们可以改变绘制标记的样式:
?
|
1
2
3
4
|
ax.scatter(x,y,c='k',s=25,alpha=1.0,marker='o')
|
现在我们能够在图像上进行标记了,但这样还不够,程序需要获取这些标记点。
实际上fig.canvas.mpl_connect("button_press_event", on_press)能够进行自定义的多参数传递,如果在每次绘制的时候将数据保存在外部传入的列表中,那么当画板被销毁时,我们就能获取到原来所有的绘制点。
这里介绍两种使用方法:
?
|
1
2
3
|
def on_key(event, arg1, arg2, arg3):
pass
canvas.mpl_connect('key_press_event', lambda event: on_key(event, plt1, plt2, plt3))
|
和
?
|
1
2
3
|
def on_key(event, args_list):
pass
fig.canvas.mpl_connect('key_press_event', lambda event: on_key(event, [plt1, plt2, plt3]))
|
这里需要注意的是scatter绘制的点,实际上并没有大小的概念,这个点实质是一个坐标。
如果需要绘制有实际面积的圆形的标记,可以使用matplotlib.patches.Circle
具体的使用如下:
?
|
1
2
3
4
5
6
|
from matplotlib.patches import Circle
fig = plt.figure()
ax = fig.add_subplot(111)
cir = Circle(xy = (event.xdata, event.ydata),facecolor = 'black', edgecolor='black',radius=10, alpha=1.0)
ax.add_patch(cir)
|
|