1.概述 pyecharts 是百度开源的,适用于数据可视化的工具,配置灵活,展示图表相对美观,顺滑。 2.安装 python3环境下的安装: pip3 install pyecharts 3.数据可视化代码 3.1 柱状图 from pyechart
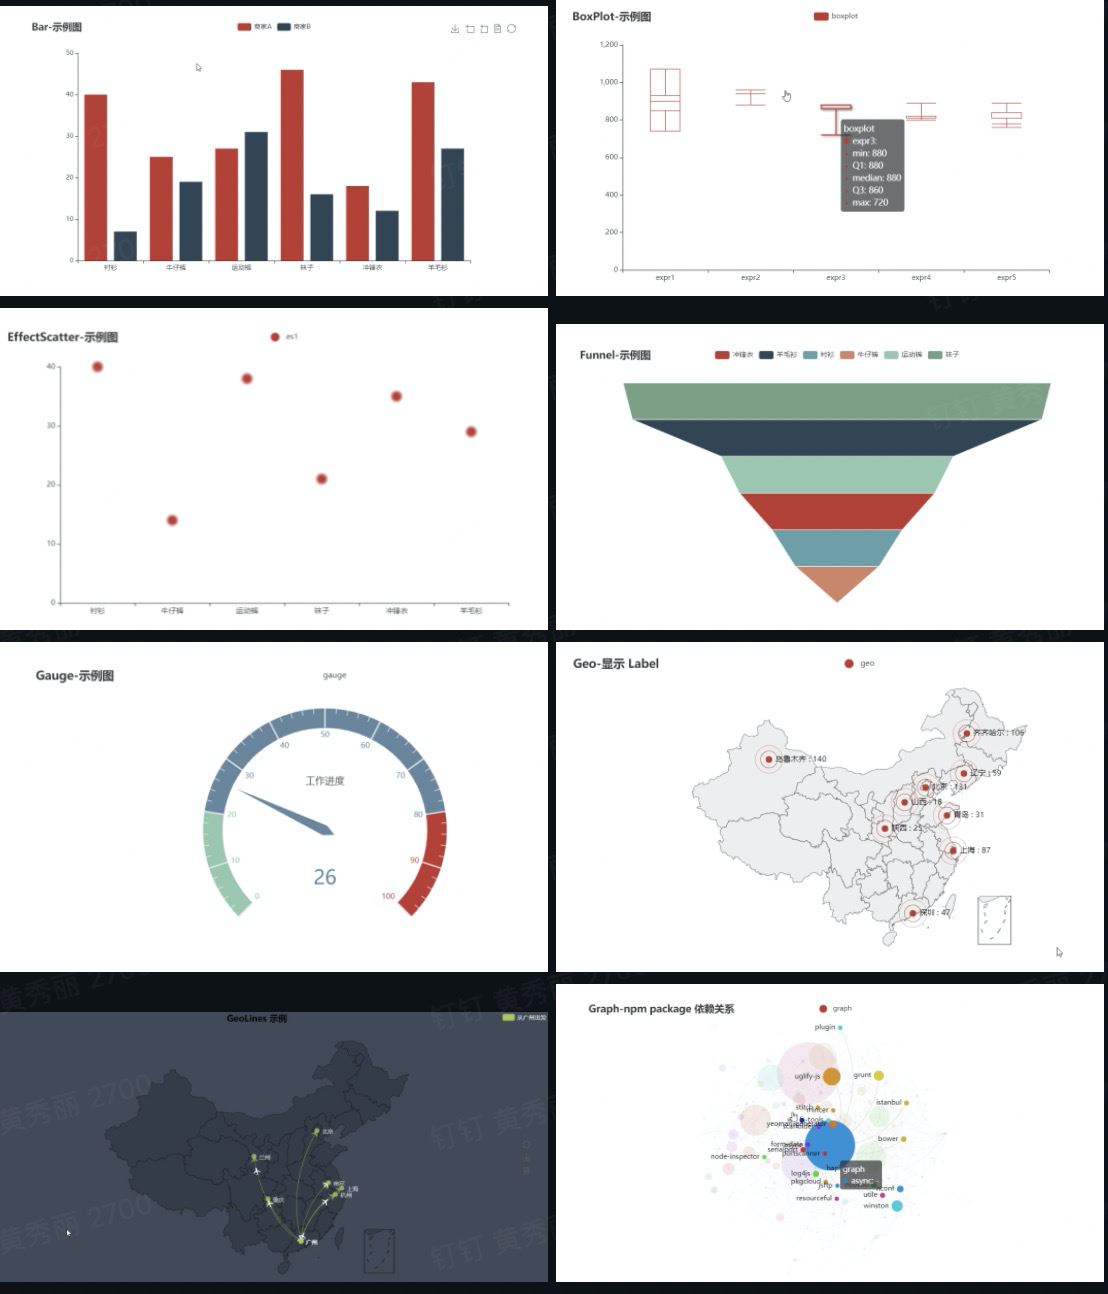
1.概述pyecharts 是百度开源的,适用于数据可视化的工具,配置灵活,展示图表相对美观,顺滑。
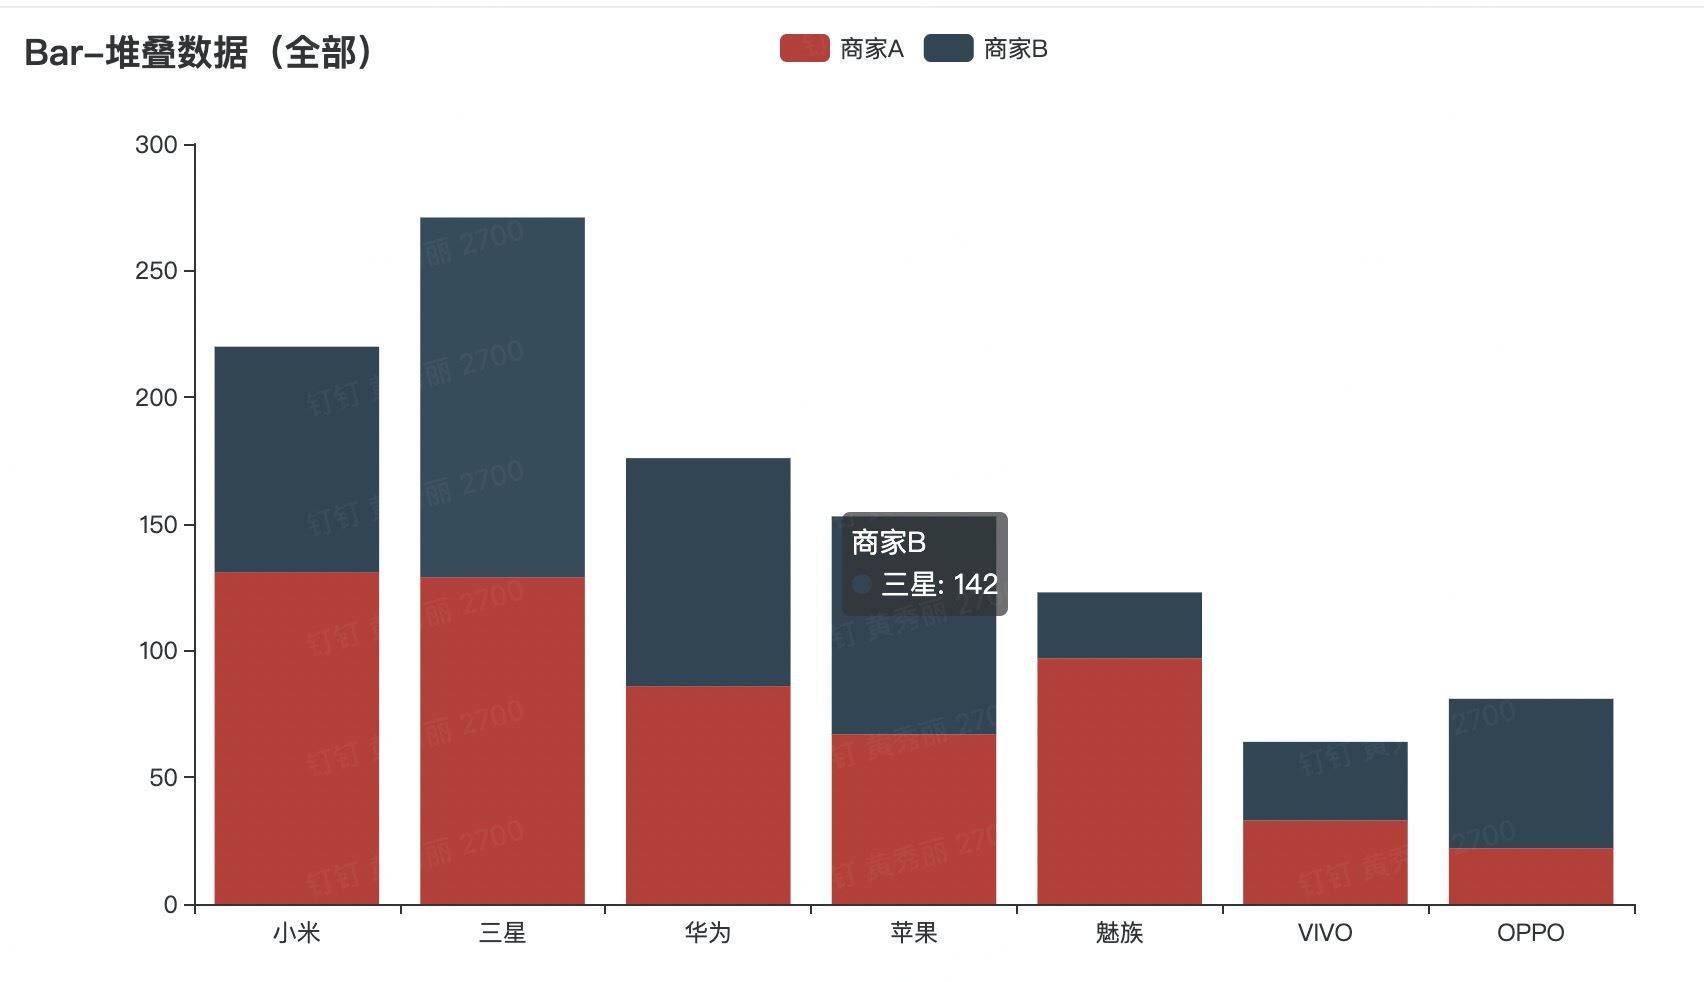
2.安装python3环境下的安装: pip3 install pyecharts 3.数据可视化代码3.1 柱状图
from pyecharts import options as opts
from pyecharts.charts import Bar
from pyecharts.faker import Faker
c = (
    Bar()
    .add_xaxis(Faker.choose())
    .add_yaxis("商家A", Faker.values(), stack="stack1")
    .add_yaxis("商家B", Faker.values(), stack="stack1")
    .set_series_opts(label_opts=opts.LabelOpts(is_show=False))
    .set_global_opts(title_opts=opts.TitleOpts(title="Bar-堆叠数据(全部)"))
    .render("bar_stack0.html")
)
执行上述代码,会在相对目录生成mycharts.html文件,通过页面打开。
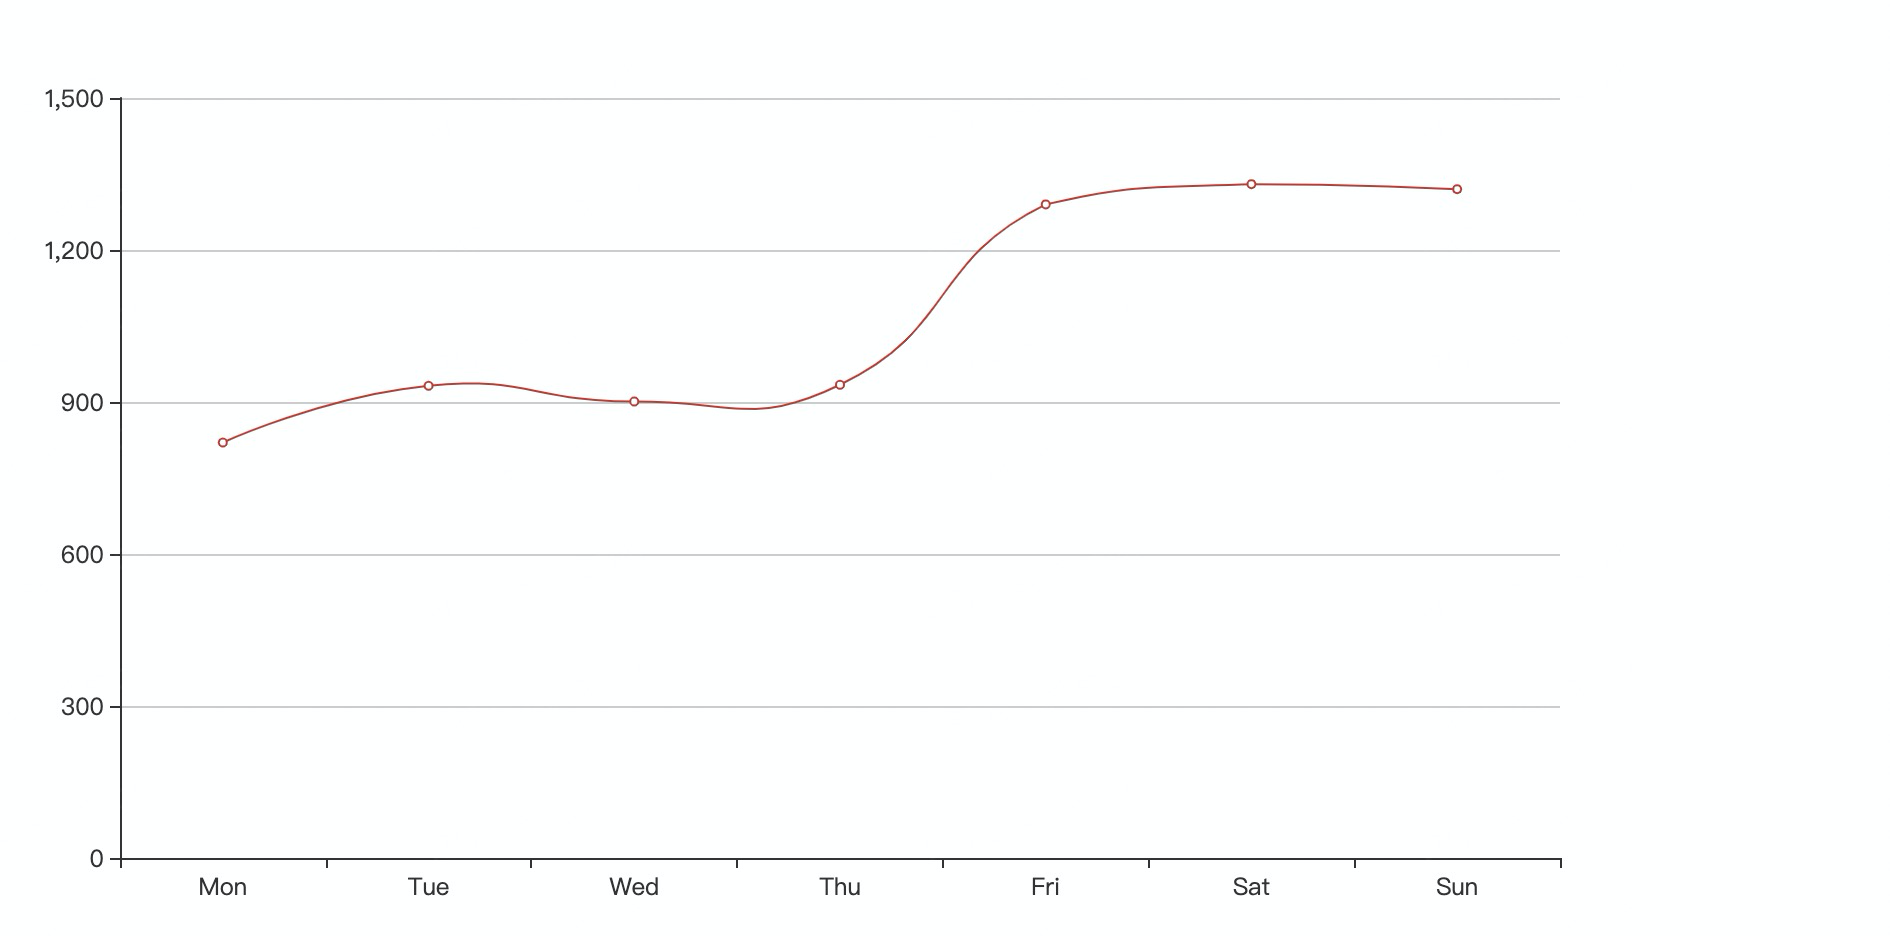
3.2 折线图
import pyecharts.options as opts
from pyecharts.charts import Line
"""
Gallery 使用 pyecharts 1.1.0
参考地址: https://echarts.apache.org/examples/editor.html?c=line-smooth
目前无法实现的功能:
暂无
"""
x_data = ["Mon", "Tue", "Wed", "Thu", "Fri", "Sat", "Sun"]
y_data = [820, 932, 901, 934, 1290, 1330, 1320]
(
    Line()
    .set_global_opts(
        tooltip_opts=opts.TooltipOpts(is_show=False),
        xaxis_opts=opts.AxisOpts(type_="category"),
        yaxis_opts=opts.AxisOpts(
            type_="value",
            axistick_opts=opts.AxisTickOpts(is_show=True),
            splitline_opts=opts.SplitLineOpts(is_show=True),
        ),
    )
    .add_xaxis(xaxis_data=x_data)
    .add_yaxis(
        series_name="",
        y_axis=y_data,
        symbol="emptyCircle",
        is_symbol_show=True,
        is_smooth=True,
        label_opts=opts.LabelOpts(is_show=False),
    )
    .render("smoothed_line_chart.html")
)
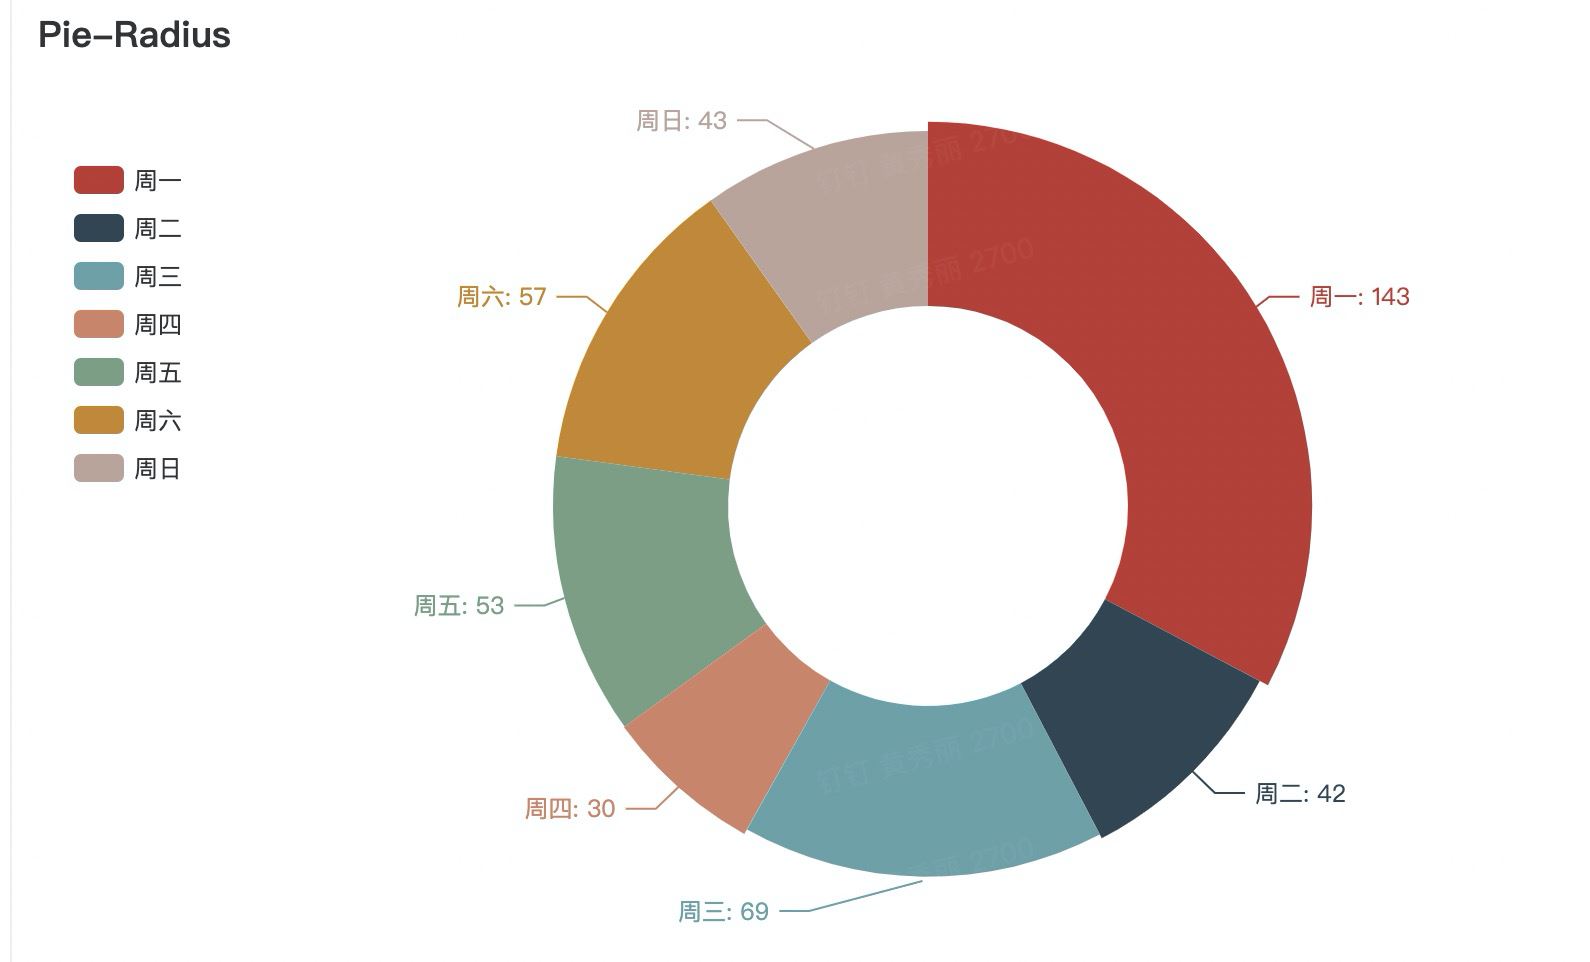
3.3 饼图
from pyecharts import options as opts
from pyecharts.charts import Pie
from pyecharts.faker import Faker
c = (
    Pie()
    .add(
        "",
        [list(z) for z in zip(Faker.choose(), Faker.values())],
        radius=["40%", "75%"],
    )
    .set_global_opts(
        title_opts=opts.TitleOpts(title="Pie-Radius"),
        legend_opts=opts.LegendOpts(orient="vertical", pos_top="15%", pos_left="2%"),
    )
    .set_series_opts(label_opts=opts.LabelOpts(formatter="{b}: {c}"))
    .render("pie_radius.html")
)
官网:Document? https://gallery.pyecharts.org/#/Bar/stack_bar_percent |


2019-06-18
2019-07-04
2021-05-23
2021-05-27
2021-05-27