忙碌了一年,今天终于放假了。原本打算好好休息一下,没成想只过了半天就觉得有点无聊。看家人和朋友们都在忙年,那我就用OpenGL导演一场烟花盛会,献给即将到来的新年吧。
一说到OpenGL,很多人都会觉得复杂,其实不然。只要掌握了几个基本的概念,借助于工具软件,任何人都可以很轻松地上手。在制作烟花之前,我先介绍一下WxGL这个三维数据快速可视化工具。
1. 安装WxGL
WxGL是一个基于PyOpenGL的三维数据可视化库,以wx为显示后端,提供Matplotlib风格的交互式应用方式。WxGL也可以和wxPython无缝结合,在wx的窗体上绘制三维模型。使用pip命令即可快速安装WxGL及其所依赖的其他模块。
|
1 |
pip install wxgl |
2. 快速体验
下面这几行代码,绘制了一个中心在坐标原点半径为1的纯色圆球。忽略模块名的话,这些代码和Matplotlib的风格是完全一致的。
|
1 2 3 4 |
>>> import wxgl.wxplot as plt >>> plt.uvsphere((0,0,0), 1, color='cyan') >>> plt.title('快速体验:$x^2+y^2=1$') >>> plt.show() |

生成一个地球模型是如此简单。
|
1 2 |
>>> plt.uvsphere((0,0,0), 1, texture='res/earth.jpg', xflip=True, yflip=False) >>> plt.show() |
让地球自转,更是易如反掌。
|
1 2 3 4 5 6 7 |
>>> plt.uvsphere((0,0,0), 1, texture='res/earth.jpg', xflip=True, yflip=False, transform = lambda tn,gms,tms : ((0, 1, 0, (0.01*tms)%360),) ) >>> plt.show() |
勾选“屏幕录制”,点击“播放”按钮,即可保存为gif文件或mp4/avi格式的视频文件。

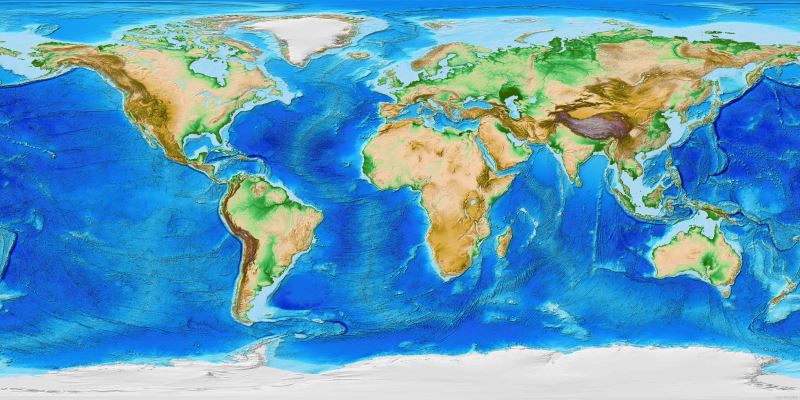
这是代码中用的的地球纹理图片,可以直接下载使用。
3. 编写自己的着色器
WxGL不仅提供了线段、散点、曲面、三维等值面等一系列绘图函数,还支持用户定制着色器程序,以实现更复杂的功能。下面这个例子,用粒子技术模拟了烟花升空的过程。
|
1 2 3 4 5 6 7 8 9 10 11 12 13 14 15 16 17 18 19 20 21 22 23 24 25 26 27 28 29 30 31 32 33 34 35 36 37 38 39 40 41 42 43 44 45 46 47 48 49 50 51 52 53 54 55 56 57 58 59 60 61 62 63 64 65 66 67 68 69 70 71 72 73 74 75 76 77 78 79 80 81 82 83 |
# -*- coding: utf-8 -*-
import numpy as np import wxgl import wxgl.wxplot as plt
def rise(n, pos, h, v, a, cycle): """烟花升空模型
n - 粒子数量 pos - 初始位置 h - 上升行程 v - 初始速度 a - 上升加速度 cycle - 循环周期 """
vshader_src = """ #version 330 core in vec4 a_Position; in vec4 a_Color; in float a_Delay; // 粒子发射延迟时间(s) uniform float u_Ts; // 持续时间(s) uniform float u_V; // 初始速度 uniform float u_A; // 上升加速度 uniform mat4 u_MVPMatrix; out vec4 v_Color; out float v_Ts; void main() { float t = u_Ts - a_Delay; if (t < 0) t = 0;
float s = u_V * t + 0.5 * u_A * t * t; gl_Position = u_MVPMatrix * vec4(a_Position.x, a_Position.y+s, a_Position.z, a_Position.w); gl_PointSize = 1; v_Color = a_Color; v_Ts = u_Ts; } """
fshader_src = """ #version 330 core in vec4 v_Color; uniform float u_Tmax; in float v_Ts; void main() { if(v_Ts > u_Tmax) discard;
vec2 temp = gl_PointCoord - vec2(0.5); float f = dot(temp, temp); if(f > 0.25) discard;
gl_FragColor = vec4(v_Color.rgb, 1); } """
vs = np.array(pos) + (np.random.random((n,3)) - 0.5) * h/100 color = np.tile(np.array((1.0,1.0,0.8)), (n,1)) delay = np.float32(np.absolute(np.random.randn(n))) / 10 tmax = (pow(v*v+2*a*h, 0.5)-v)/a + delay.max()
m = wxgl.Model(wxgl.POINTS, vshader_src, fshader_src, sprite=True) m.set_vertex('a_Position', vs) m.set_color('a_Color', color) m.set_argument('a_Delay', delay) m.set_argument('u_Ts', lambda tn,gms,tms:(tms/1000)%cycle) m.set_argument('u_V', v) m.set_argument('u_A', a) m.set_argument('u_Tmax', tmax) m.set_mvp_matrix('u_MVPMatrix') # 设置模型矩阵、视点矩阵和投影矩阵
return m
vs = np.array([ [-1.5,2,1], [-1.5,0,1], [1.5,2,1], [1.5,0,1], [-1.5,2,-1], [-1.5,0,-1], [1.5,2,-1], [1.5,0,-1]]) vs = vs[[0,1,2,3,0,2,1,3,4,5,6,7,4,6,5,7,0,4,1,5,2,6,3,7]] m = rise(n=500, pos=(0,0,0), h=1.5, v=2, a=-1.2, cycle=5)
plt.figure(zoom=0.7, elev=10) plt.line(vs, color=(0,1,1), method='isolate') # 六面体线框,表示烟花燃放的空间 plt.model(m) plt.show() |
4. 绽放的烟花
只要理解了烟花升空的代码,很容易写出烟花在空中爆炸的着色器程序。下面的代码除了烟花升空的着色器,还提供了两种烟花爆炸的着色器,其中用到了一个纹理图片,可直接下载下面这张图使用。

如果将上面的纹理图片替换成文字,就可以在烟花爆炸的瞬间显示出文字了。WxGL提供了一个文本转PIL图形对象的函数,可以直接作为纹理使用。
|
1 2 3 4 5 6 7 8 9 10 11 12 13 14 15 16 17 18 19 20 21 22 23 24 25 26 27 28 29 30 31 32 33 34 35 36 37 38 39 40 41 42 43 44 45 46 47 48 49 50 51 52 53 54 55 56 57 58 59 60 61 62 63 64 65 66 67 68 69 70 71 72 73 74 75 76 77 78 79 80 81 82 83 84 85 86 87 88 89 90 91 92 93 94 95 96 97 98 99 100 101 102 103 104 105 106 107 108 109 110 111 112 113 114 115 116 117 118 119 120 121 122 123 124 125 126 127 128 129 130 131 132 133 134 135 136 137 138 139 140 141 142 143 144 145 146 147 148 149 150 151 152 153 154 155 156 157 158 159 160 161 162 163 164 165 166 167 168 169 170 171 172 173 174 175 176 177 178 179 180 181 182 183 184 185 186 187 188 189 190 191 192 193 194 195 196 197 198 199 200 201 202 203 204 205 206 207 208 209 210 211 212 213 214 215 216 217 218 219 220 221 222 223 224 225 226 227 228 229 230 231 232 233 234 235 236 237 238 239 240 241 242 243 244 |
# -*- coding: utf-8 -*-
import numpy as np import wxgl import wxgl.wxplot as plt
def rise(n, pos, h, v, a, cycle): """烟花升空模型
n - 粒子数量 pos - 初始位置 h - 上升行程 v - 初始速度 a - 上升加速度 cycle - 循环周期 """
vshader_src = """ #version 330 core in vec4 a_Position; in vec4 a_Color; in float a_Delay; // 粒子发射延迟时间(s) uniform float u_Ts; // 持续时间(s) uniform float u_V; // 初始速度 uniform float u_A; // 上升加速度 uniform mat4 u_MVPMatrix; out vec4 v_Color; out float v_Ts; void main() { float t = u_Ts - a_Delay; if (t < 0) t = 0;
float s = u_V * t + 0.5 * u_A * t * t; gl_Position = u_MVPMatrix * vec4(a_Position.x, a_Position.y+s, a_Position.z, a_Position.w); gl_PointSize = 1; v_Color = a_Color; v_Ts = u_Ts; } """
fshader_src = """ #version 330 core in vec4 v_Color; uniform float u_Tmax; in float v_Ts; void main() { if(v_Ts > u_Tmax) discard;
vec2 temp = gl_PointCoord - vec2(0.5); float f = dot(temp, temp); if(f > 0.25) discard;
gl_FragColor = vec4(v_Color.rgb, 1); } """
vs = np.array(pos) + (np.random.random((n,3)) - 0.5) * h/100 color = np.tile(np.array((1.0,1.0,0.8)), (n,1)) delay = np.float32(np.absolute(np.random.randn(n))) / 10 tmax = (pow(v*v+2*a*h, 0.5)-v)/a + delay.max()
m = wxgl.Model(wxgl.POINTS, vshader_src, fshader_src, sprite=True) m.set_vertex('a_Position', vs) m.set_color('a_Color', color) m.set_argument('a_Delay', delay) m.set_argument('u_Ts', lambda tn,gms,tms:(tms/1000)%cycle) m.set_argument('u_V', v) m.set_argument('u_A', a) m.set_argument('u_Tmax', tmax) m.set_mvp_matrix('u_MVPMatrix') # 设置模型矩阵、视点矩阵和投影矩阵
return m, tmax
def bomb_1(n, pos, start, a, cycle): """烟花爆炸模型
n - 粒子数量 pos - 位置 start - 时间 a - 下降加速度 cycle - 循环周期 """
vshader_src = """ #version 330 core in vec4 a_Position; in vec3 a_Data; uniform float u_Ts; uniform float u_Start; uniform float u_A; uniform mat4 u_MVPMatrix; out vec4 v_Color; out float v_Ts; void main() { float t = u_Ts - u_Start; if (t < 0) t = 0;
float lat = radians((a_Data.x - 0.5) * 90); float lon = radians(a_Data.y * 360); float r = (a_Data.z * 0.3 + 0.7) * 0.3 * t * (1 + 0.3 * a_Position.z); float y = r * sin(lat) + a_Position.y - 0.5*u_A*t*t; float xz = r * cos(lat); float x = xz * cos(lon) + a_Position.x; float z = xz * sin(lon) + a_Position.z;
gl_Position = u_MVPMatrix * vec4(x,y,z,a_Position.w); gl_PointSize = 3 * t; v_Ts = t;
int i = gl_VertexID % 6; if (i == 0) v_Color = vec4(1,0,0,1); else if (i == 1) v_Color = vec4(0,1,0,1); else if (i == 2) v_Color = vec4(0,0,1,1); else if (i == 3) v_Color = vec4(1,1,0,1); else if (i == 4) v_Color = vec4(0,1,1,1); else v_Color = vec4(1,0,1,1); } """
fshader_src = """ #version 330 core in vec4 v_Color; in float v_Ts; void main() { if(v_Ts <= 0 || v_Ts > 2) discard;
vec2 temp = gl_PointCoord - vec2(0.5); float f = dot(temp, temp); if(f > 0.25) discard;
//float alpha = v_Color.a * exp(1-30*f) * (4-v_Ts*v_Ts)/2; float alpha = v_Color.a * (1-4*f) * (4-v_Ts*v_Ts)/2; gl_FragColor = vec4(v_Color.rgb, alpha); } """
vs = np.tile(np.array(pos), (n,1)) data = np.float32(np.random.random((n,3)))
m = wxgl.Model(wxgl.POINTS, vshader_src, fshader_src, sprite=True, opacity=False) m.set_vertex('a_Position', vs) m.set_argument('a_Data', data) m.set_argument('u_Start', start) m.set_argument('u_A', a) m.set_argument('u_Ts', lambda tn,gms,tms:(tms/1000)%cycle) m.set_mvp_matrix('u_MVPMatrix') # 设置模型矩阵、视点矩阵和投影矩阵
return m
def bomb_2(pos, start, texture, a, size, cycle): """烟花爆炸模型
pos - 位置 start - 时间 texture - 纹理 a - 下降加速度 cycle - 循环周期 """
vshader_src = """ #version 330 core in vec4 a_Position; uniform float u_Ts; uniform float u_Start; uniform float u_A; uniform float u_Size; uniform mat4 u_MVPMatrix; out float v_Ts; void main() { float t = u_Ts - u_Start; if (t < 0) t = 0;
if (t < 2) gl_PointSize = t * u_Size/2 * (1 + 0.3 * a_Position.z); else gl_PointSize = u_Size * (1 + 0.3 * a_Position.z);
gl_Position = u_MVPMatrix * vec4(a_Position.x, a_Position.y-0.5*u_A*t*t, a_Position.z, a_Position.w); v_Ts = t; } """
fshader_src = """ #version 330 core uniform sampler2D u_Fireworks; in float v_Ts; void main() { if(v_Ts <= 0 || v_Ts > 2) discard;
vec4 color = texture2D(u_Fireworks, gl_PointCoord); gl_FragColor = vec4(color.rgb, color.a*(4-v_Ts*v_Ts)/2); } """
vs = np.array(pos).reshape(-1,3)
m = wxgl.Model(wxgl.POINTS, vshader_src, fshader_src, sprite=True) m.set_vertex('a_Position', vs) m.set_argument('u_A', a) m.set_argument('u_Size',size) m.set_argument('u_Start', start) m.set_argument('u_Ts', lambda tn,gms,tms:(tms/1000)%cycle) m.add_texture('u_Fireworks', texture, wxgl.TEXTURE_2D, yflip=False) m.set_mvp_matrix('u_MVPMatrix') # 设置模型矩阵、视点矩阵和投影矩阵
return m
if __name__ == '__main__': vs = np.array([[-1.5,2,1], [-1.5,0,1], [1.5,2,1], [1.5,0,1], [-1.5,2,-1], [-1.5,0,-1], [1.5,2,-1], [1.5,0,-1]]) vs = vs[[0,1,2,3,0,2,1,3,4,5,6,7,4,6,5,7,0,4,1,5,2,6,3,7]]
plt.figure(zoom=0.5, elev=10) plt.line(vs, color=(0,1,1,0), method='isolate') # 六面体线框,表示烟花燃放的空间
# ------------------------------ h, v, a, cycle = 1.7, 2.2, -1.2, 4 for i, ch in enumerate('新春快乐'): x = -1.5 + i m1, start = rise(n=300, pos=(x,0,1), h=h, v=v, a=a, cycle=cycle) m2 = bomb_1(200, (x,h,1), start, a=0.1, cycle=cycle) m3 = bomb_2((x,h,1), start, wxgl.text2image(ch, 96, (1,0,0)), a=0.1, size=100, cycle=cycle) plt.model(m1) plt.model(m2) plt.model(m3)
# ------------------------------- for i in range(20): x, z = (np.random.random()-0.5)*4, (np.random.random()-0.5)*2 h, v, a = 1.5+(np.random.random()-0.5)*0.4, 2.2, -1.2 cycle = np.random.randint(4, 7) m1, start = rise(n=300, pos=(x,0,z), h=h, v=v, a=a, cycle=cycle) m2 = bomb_1(200, (x,h,z), start, a=0.1, cycle=cycle) plt.model(m1) plt.model(m2)
# ------------------------------- for i in range(20): x, z = (np.random.random()-0.5)*4, (np.random.random()-0.5)*2 h, v, a = 1.5+(np.random.random()-0.5)*0.4, 2.3, -1.2 cycle = np.random.randint(4, 7) m1, start = rise(n=300, pos=(x,0,z), h=h, v=v, a=a, cycle=cycle) m2 = bomb_2((x,h,z), start, 'res/fw.png', a=0.1, size=300, cycle=cycle) plt.model(m1) plt.model(m2)
plt.show() |
最终的效果如下面的gif所示。