1.配置filebeat收集error日志
只收集正常日志往往是不完整的,错误日志更需要收集起来
所有集群都按如下配置,其实就是增加了一个type和一个index
|
1 2 3 4 5 6 7 8 9 10 11 12 13 14 15 16 17 18 19 20 21 22 23 24 25 26 27 28 29 30 31 32 33 34 35 36 37 38 39 40 41 42 43 44 |
vim /etc/filebeat/filebeat.yml filebeat.inputs: - type: log enabled: true paths: - /var/log/nginx/www_access.log json.keys_under_root: true json.overwrite_keys: true tags: ["www"] - type: log enabled: true paths: - /var/log/nginx/bbs_access.log json.keys_under_root: true json.overwrite_keys: true tags: ["bbs"] - type: log enabled: true paths: - /var/log/nginx/blog_access.log json.keys_under_root: true json.overwrite_keys: true tags: ["blog"] - type: log enabled: true paths: - /var/log/nginx/error.log tags: ["error"] output.elasticsearch: hosts: ["192.168.81.210:9200"] indices: - index: "nginx-www-access-%{+yyyy.MM.dd}" when.contains: tags: "www" - index: "nginx-bbs-access-%{+yyyy.MM.dd}" when.contains: tags: "bbs" - index: "nginx-blog-access-%{+yyyy.MM.dd}" when.contains: tags: "blog" - index: "nginx-error-%{+yyyy.MM.dd}" when.contains: tags: "error" systemctl restart filebeat |
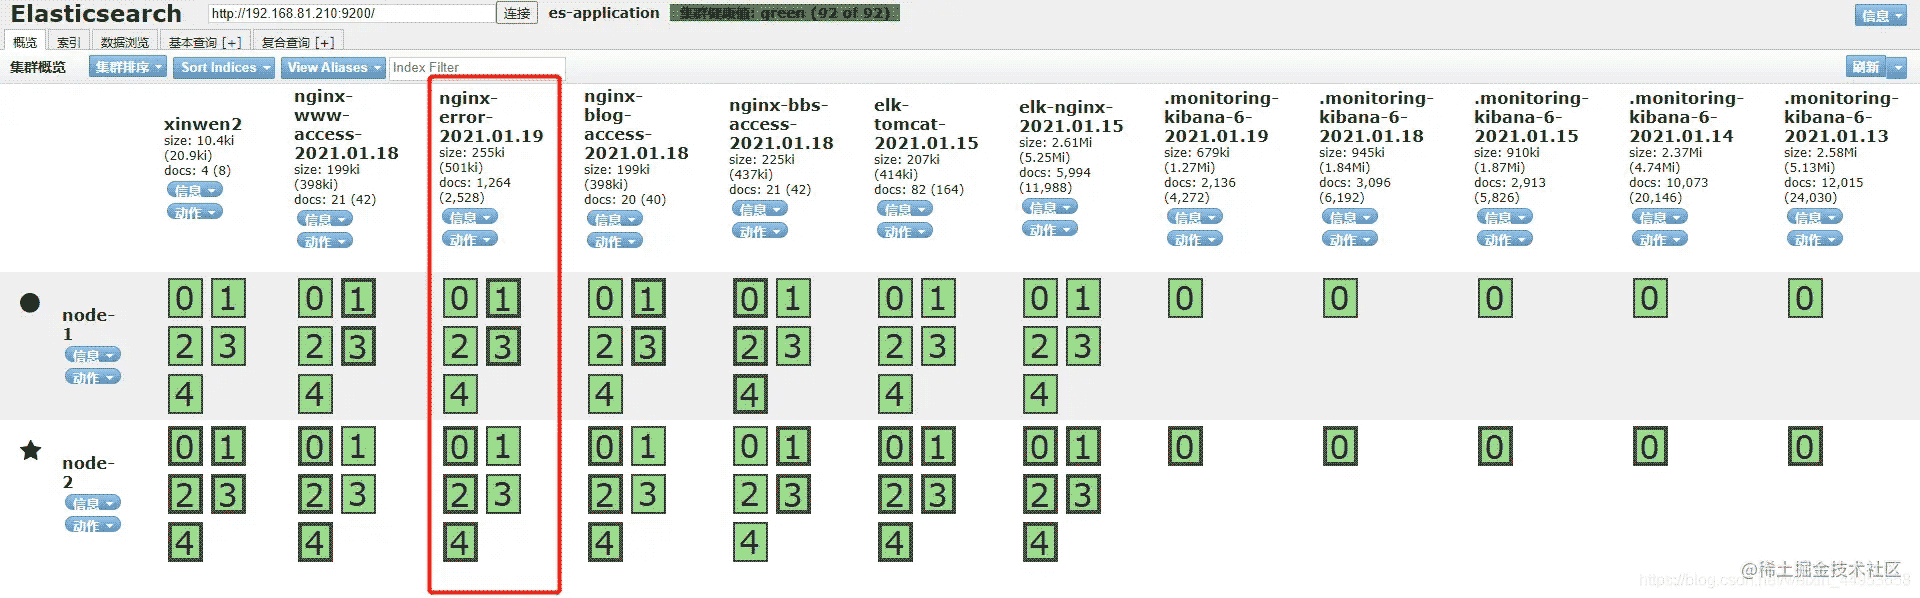
2.查看es是否产生error索引
已经生成
3.在kibana上关联es索引
点击Managerment---索引模式---创建索引
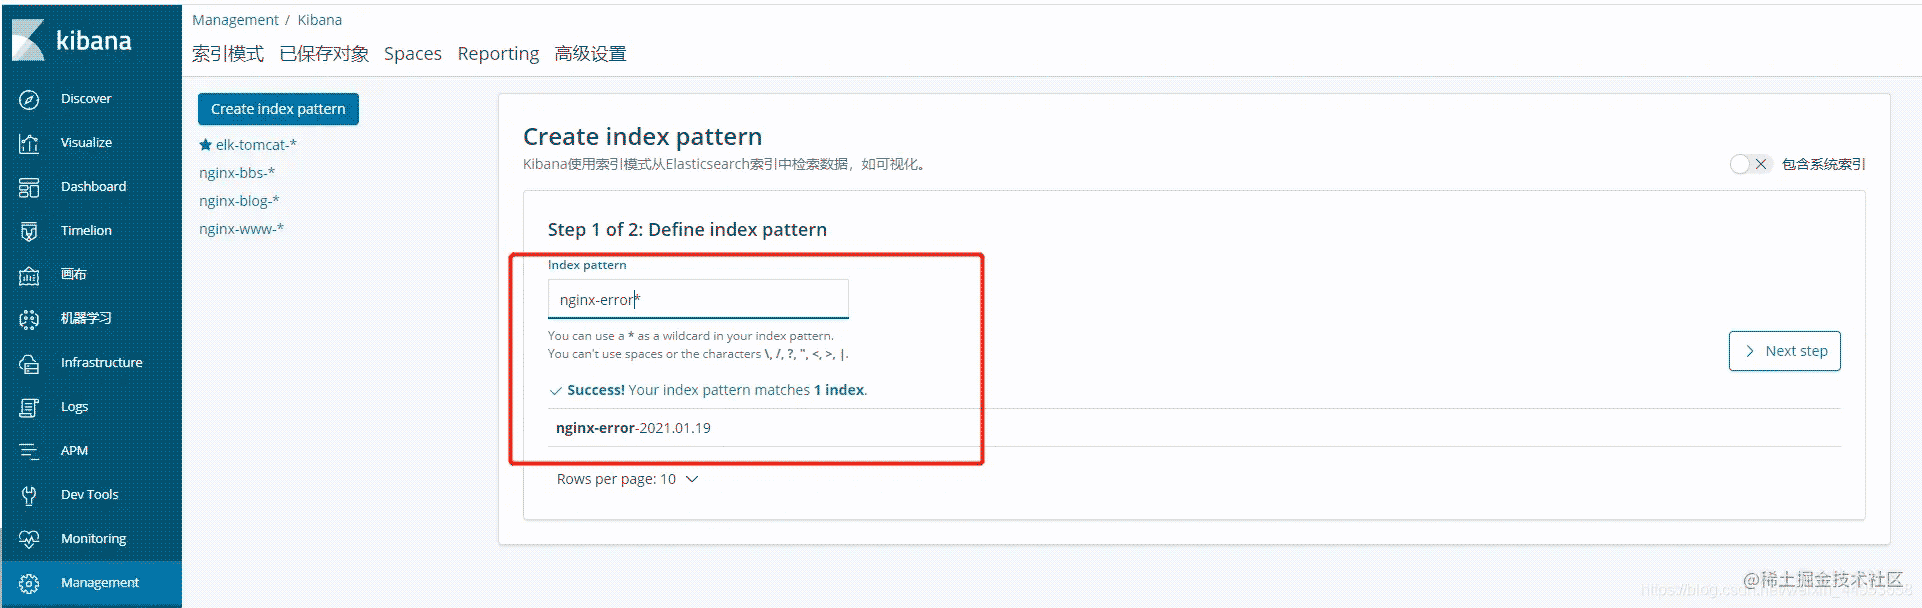
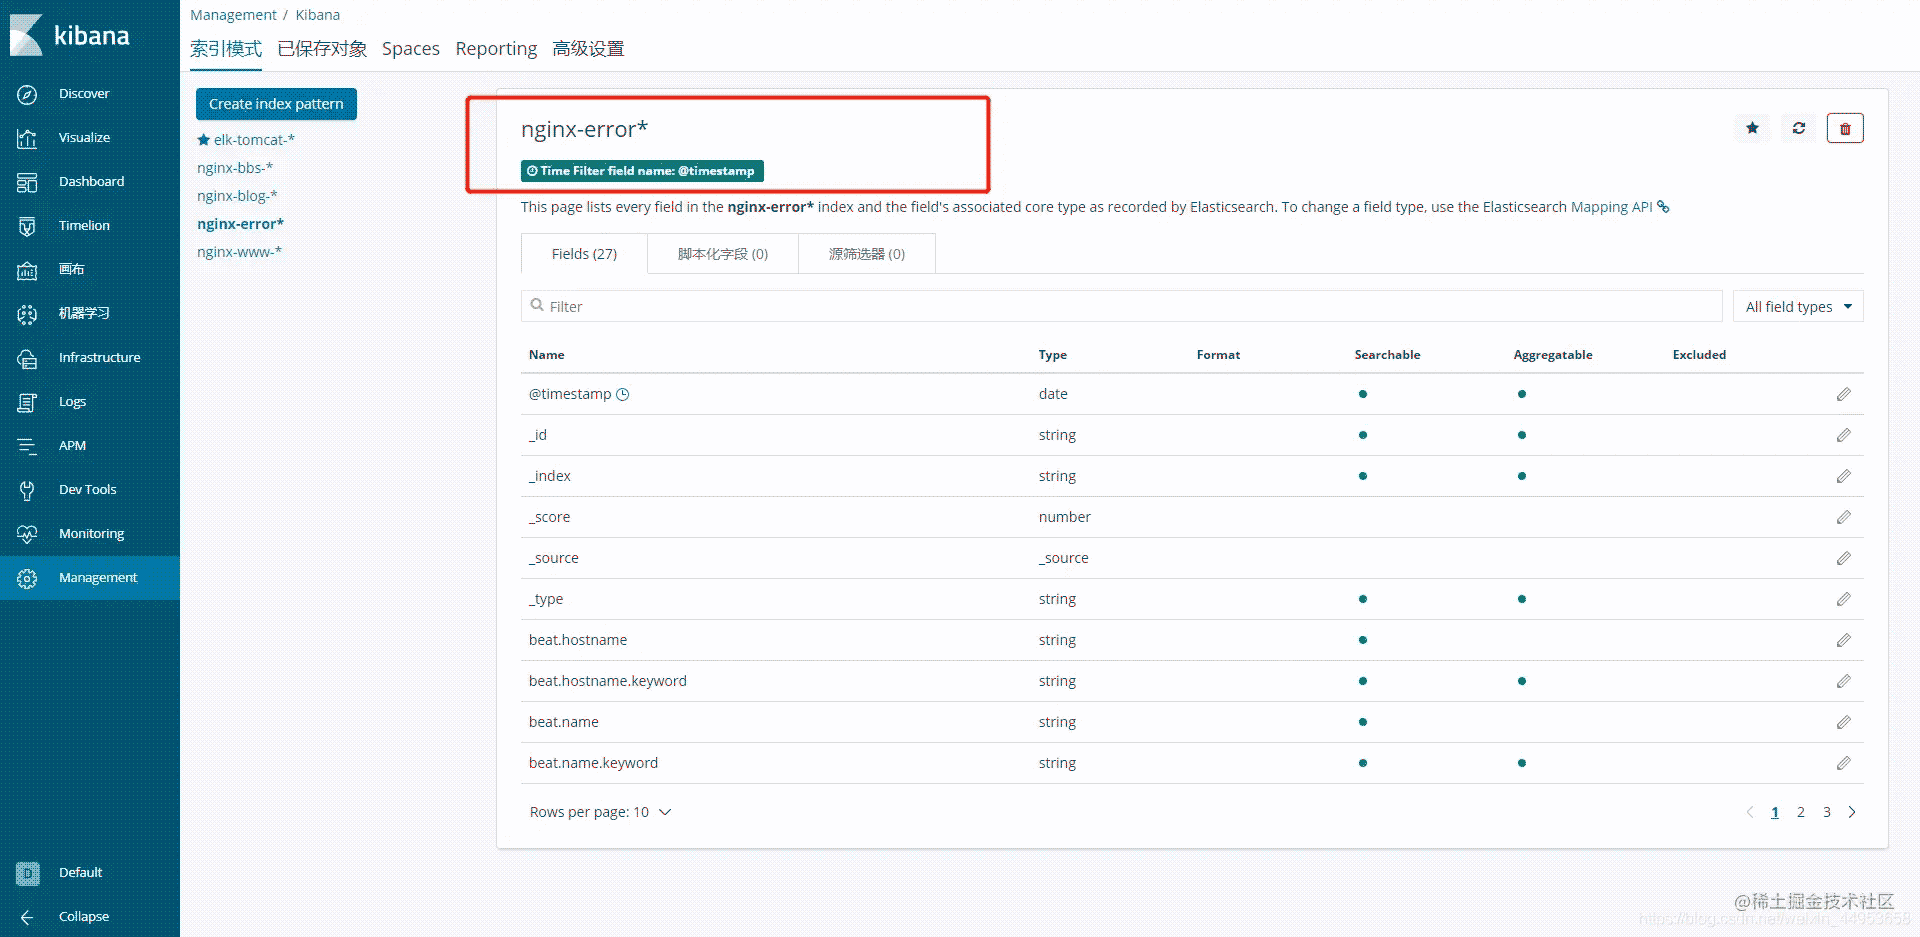
创建成功
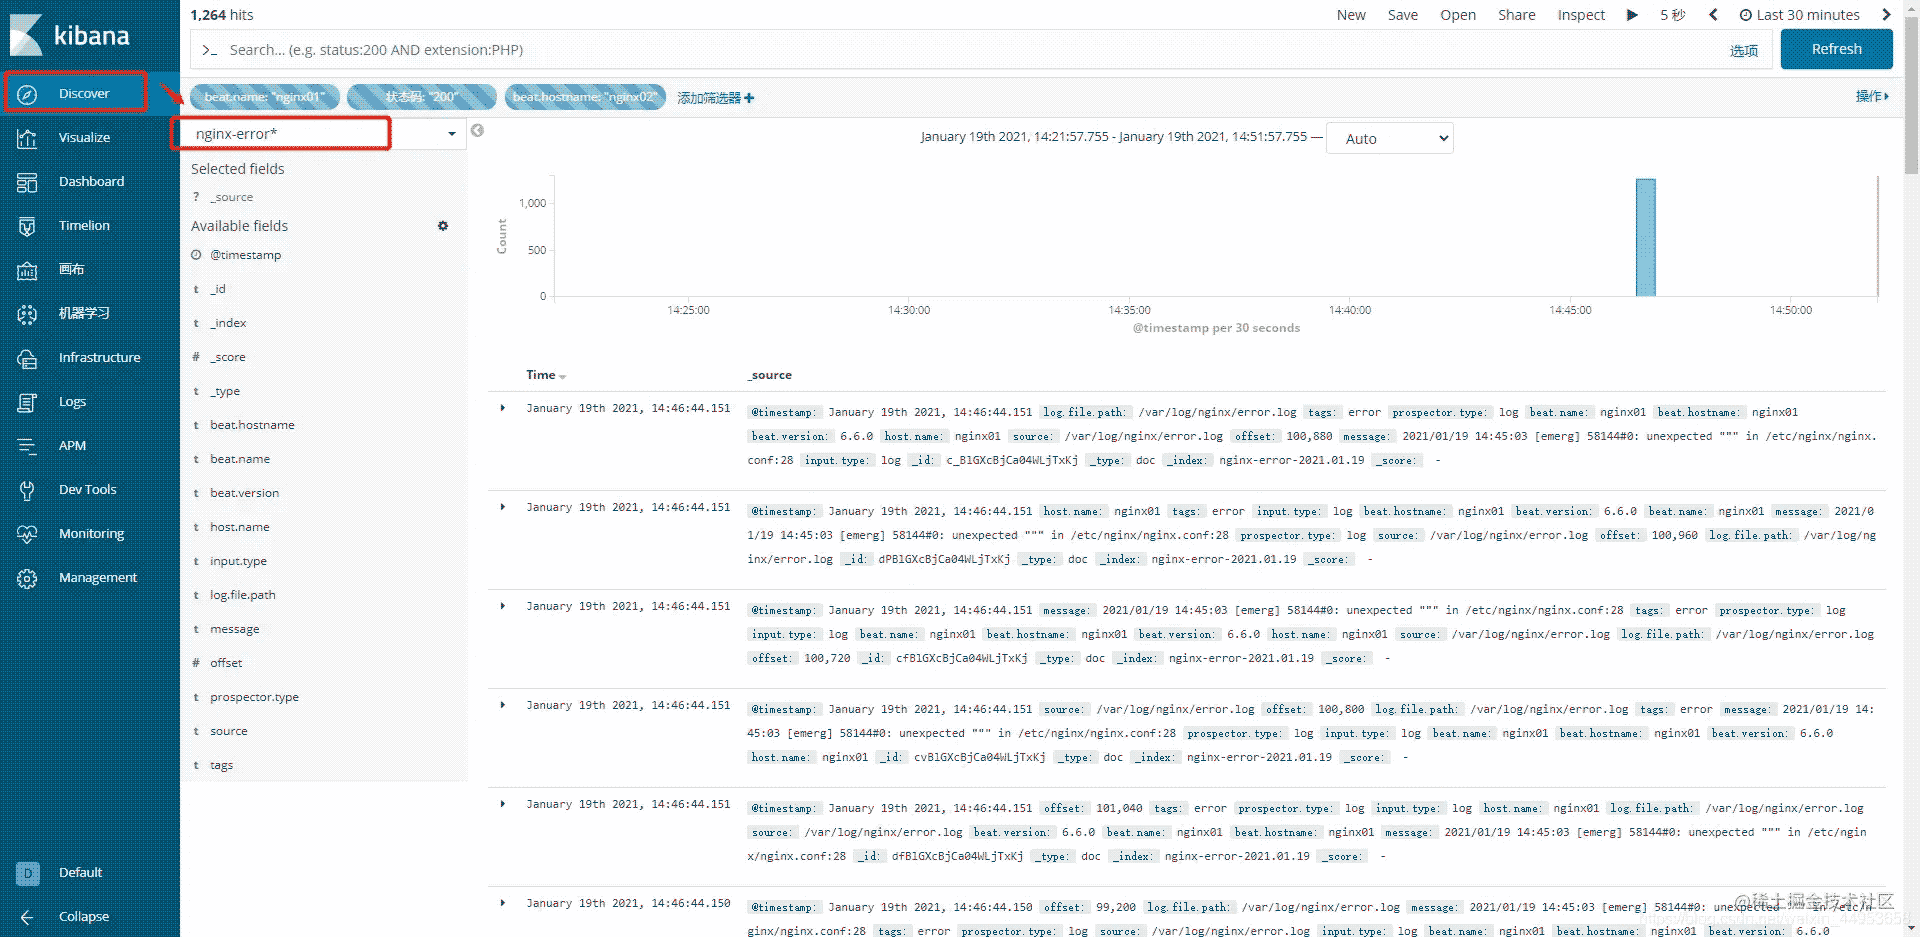
4.在kibana上统计错误日志
点击Discovery---选择索引即可查看,根据自己的需求进行统计即可