鼎鼎大名的南方城市长沙很早就入冬了,街上各种大衣,毛衣,棉衣齐齐出动。
这段时间全国各地大风呜呜地吹,很多地方断崖式降温。
虽然前几天短暂的温度回升,但肯定是为了今天的超级降温,一大早的就开始狂风四起。
周五早晨,终于体验了一把久违冷冷的冰雨在脸上胡乱的拍!昨天还有10几度的天气,今天就 只有2-3°了,真真是老天爷的脸七十二变~
广东的朋友们,听说你们哪儿最低温度都是10几度,我实名羡慕了——(要我说从哪儿听说的,昨天跟刺激战场打游戏的合作队友哪儿听说的。狠狠羡慕住了.jpg)
没啥事儿,跟大家谈一谈天气,哈哈哈,今天就给大家用代码写一款Python版天气预报系统,是Tkinter界面化的,还会制作温度折线图跟气温饼图哦~一整个期待住了吧!
一、前期准备
1)运行环境
本文用到的环境如下——
Python3、Pycharm社区版,第三方模块:tkinter、bs4(BeautifulSoup)、pandas、
prettytable、matplotlib、re。部分自带的库只要安装完Python就可以直接使用了
一般安装:pip install +模块名
镜像源安装:pip install -i https://pypi.douban.com/simple/+模块名
有准备一些数据源素材等这些大家可以用自己准备的就可以了。
二、代码展示
|
1 2 3 4 5 6 7 8 9 10 11 12 13 14 15 16 17 18 19 20 21 22 23 24 25 26 27 28 29 30 31 32 33 34 35 36 37 38 39 40 41 42 43 44 45 46 47 48 49 50 51 52 53 54 55 56 57 58 59 60 61 62 63 64 65 66 67 68 69 70 71 72 73 74 75 76 77 78 79 80 81 82 83 84 85 86 87 88 89 90 91 92 93 94 95 96 97 98 99 100 101 102 103 104 105 106 107 108 109 110 111 112 113 114 115 116 117 118 119 120 121 122 123 124 125 126 127 128 129 130 131 132 133 134 135 136 137 138 139 140 141 142 143 144 145 146 147 148 149 150 151 |
#coding:utf-8 from tkinter import * import re from time import sleep from urllib.request import urlopen from bs4 import BeautifulSoup import pandas import prettytable import matplotlib.pyplot as plt from datetime import datetime LOG_LINE_NUM = 0
class MY_GUI(): def __init__(self,init_window_name): self.init_window_name = init_window_name
#设置窗口 def set_init_window(self): self.init_window_name.title("天气预报") #窗口名 self.init_window_name.geometry('1000x500+200+50') #标签 self.init_data_label = Label(self.init_window_name, text="输入城市名") self.init_data_label.grid(row=0, column=0) self.result_data_label = Label(self.init_window_name, text="天气预测结果") self.result_data_label.grid(row=0, column=12) #文本框 self.init_data_Text = Text(self.init_window_name, width=20, height=1) #城市名录入框 self.init_data_Text.grid(row=1, column=0, rowspan=2, columnspan=5) self.result_data_Text = Text(self.init_window_name, width=100, height=30) #处理结果展示 self.result_data_Text.grid(row=1, column=12, rowspan=10, columnspan=10) #按钮 self.str_trans_to_md7_button = Button(self.init_window_name, text="获取天气情况", bg="lightblue", width=10,command=self.str_trans_to_md7) # 调用内部方法 加()为直接调用 self.str_trans_to_md7_button.grid(row=1, column=11) self.str_trans_to_img_button = Button(self.init_window_name, text="获取天气统计图", bg="lightblue", width=10,command=self.str_trans_to_img) # 调用内部方法 加()为直接调用 self.str_trans_to_img_button.grid(row=2, column=11)
#功能函数 def str_trans_to_md7(self): #储存天气情况的列表 date,wea,tem_high,tem_low,wind_dire,wind_speed = [],[],[],[],[],[] #城市转ID city_id = pandas.read_excel('city_id.xlsx') dict_c = city_id.set_index('City_CN').T.to_dict('list') city = self.init_data_Text.get(1.0,END).strip() test_id = dict_c[city] test_id.append("".join(filter(str.isdigit, test_id[0]))) print('城市ID:',test_id[1]) #爬七日天气 html_ID = "http://www.weather.com.cn/weather/"+test_id[1]+".shtml" html = urlopen(html_ID) soup = BeautifulSoup(html.read(),'html.parser') ag_links = soup.find_all("li", {"class": re.compile('sky skyid lv\d')}) for ag in ag_links: date.append(ag.h1.get_text()) wea.append(ag.p.get_text()) tem_high.append(ag.span.get_text()) win = re.findall('(?<= title=").*?(?=")', str(ag.find('p','win').find('em'))) #正则问题的处理,摘自csdn wind_dire.append( '-'.join(win)) for i in range(7): tem_low.append(soup.select('.tem i')[i].get_text()) wind_speed.append(soup.select('.win i')[i].get_text()) #输出图表 table_ = prettytable.PrettyTable() table_.field_names = ['日期','天气', '最高温度','最低温度','风向','风力'] for i in range(0,len(date)): table_.add_row([date[i], wea[i], tem_high[i],tem_low[i],wind_dire[i],wind_speed[i]]) print(city,'七日天气') print(table_) weafile=open("近七日天气.txt","w+") weafile.write(city) weafile.write(test_id[1]+'/n') weafile.write(str(table_)) weafile.close self.result_data_Text.delete(1.0,END) self.result_data_Text.insert(1.0,table_) def str_trans_to_img(self):#进行统计图的制作 infopen = open('近七日天气.txt', 'r', encoding='gbk') outopen = open('out1.txt', 'w', encoding='gbk') lines = infopen.readlines() for line in lines: if line.split(): outopen.writelines(line) else: outopen.writelines("") infopen.close() outopen.close() with open("out1.txt", encoding='gbk') as fp_in: with open('out.txt', 'w', encoding='gbk') as fp_out: fp_out.writelines(line for i, line in enumerate(fp_in) if i > 2 and i<10) # clearnumber file = open("out.txt", "r") # 以只读模式读取文件 something=file.readlines() new=[] for x in something: first = x.strip('\n') second=first.split() while '|' in second: second.remove('|') new.append(second)
dates, highs, lows = [], [], [] for day in range(7): highs.append(int(new[day][2])) lows.append(int(new[day][3][0:2])) dates.append(new[day][0])
fig = plt.figure(dpi=128, figsize=(10, 6)) plt.plot(dates, highs, c='red', alpha=0.5) # alpha指定颜色透明度 plt.plot(dates, lows, c='blue', alpha=0.5) # 注意dates和highs 以及lows是匹配对应的 plt.fill_between(dates, highs, lows, facecolor='blue', alpha=0.1) # facecolor指定了区域的颜色 # 设置图形格式 plt.rcParams['font.sans-serif']=['SimHei'] #显示中文标签 plt.rcParams['axes.unicode_minus']=False plt.title("近七日温度", fontsize=24) plt.xlabel('', fontsize=14) fig.autofmt_xdate() # 让x轴标签斜着打印避免拥挤 plt.ylabel('Temperature(℃)', fontsize=14) plt.tick_params(axis='both', which='major', labelsize=14) plt.savefig('温度折线图.jpg') plt.show()
dic_wea = {} for i in range(0, 7): if new[i][1] in dic_wea.keys(): dic_wea[new[i][1]] += 1 else: dic_wea[new[i][1]] = 1 plt.rcParams['font.sans-serif'] = ['SimHei'] print(dic_wea) explode = [0.01] * len(dic_wea.keys()) color = ['lightskyblue', 'silver', 'yellow', 'salmon', 'grey', 'lime', 'gold', 'red', 'green', 'pink'] plt.pie(dic_wea.values(), explode=explode, labels=dic_wea.keys(), autopct='%1.1f%%', colors=color) plt.title('未来7天气候分布饼图') plt.savefig('气候饼图.jpg') plt.show()
def gui_start(): init_window = Tk() #实例化出一个父窗口
ZMJ_PORTAL = MY_GUI(init_window)
ZMJ_PORTAL.set_init_window() # 设置根窗口默认属性
init_window.mainloop() #父窗口进入事件循环,可以理解为保持窗口运行,否则界面不展示
gui_start() |
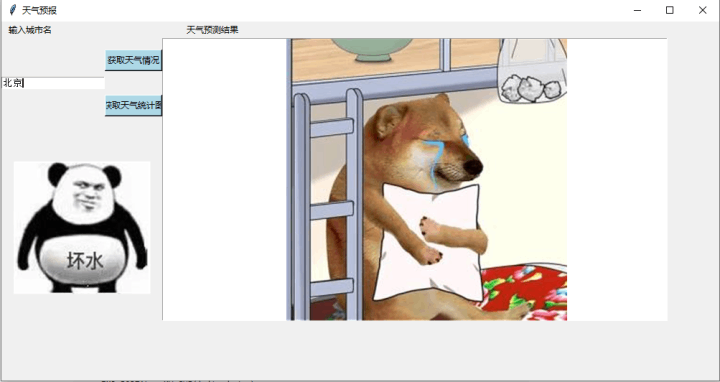
三、效果展示
1)天气预报系统
?2)温度折线图

3)气温饼图