主程序代码
|
1 2 3 4 5 6 7 8 9 10 11 12 13 14 15 16 17 18 19 20 21 22 23 24 25 26 27 28 29 30 31 32 33 34 35 36 37 38 39 40 41 42 43 44 45 46 47 48 49 50 51 52 53 54 55 56 57 58 59 60 61 62 |
import sys import numpy as np from PyQt5.QtGui import * from PyQt5.QtCore import * from PyQt5.QtWidgets import *
import pyqtgraph as pg
from ui_demo02 import Ui_MainWindow
class GraphDemowWindow(QMainWindow, Ui_MainWindow): def __init__(self, parent=None): super(GraphDemowWindow, self).__init__(parent) self.setupUi(self)
pg.setConfigOptions(antialias=True) # 设置开启抗锯齿
self.drawGraphicsLayoutWidget() self.drawPoltWidget()
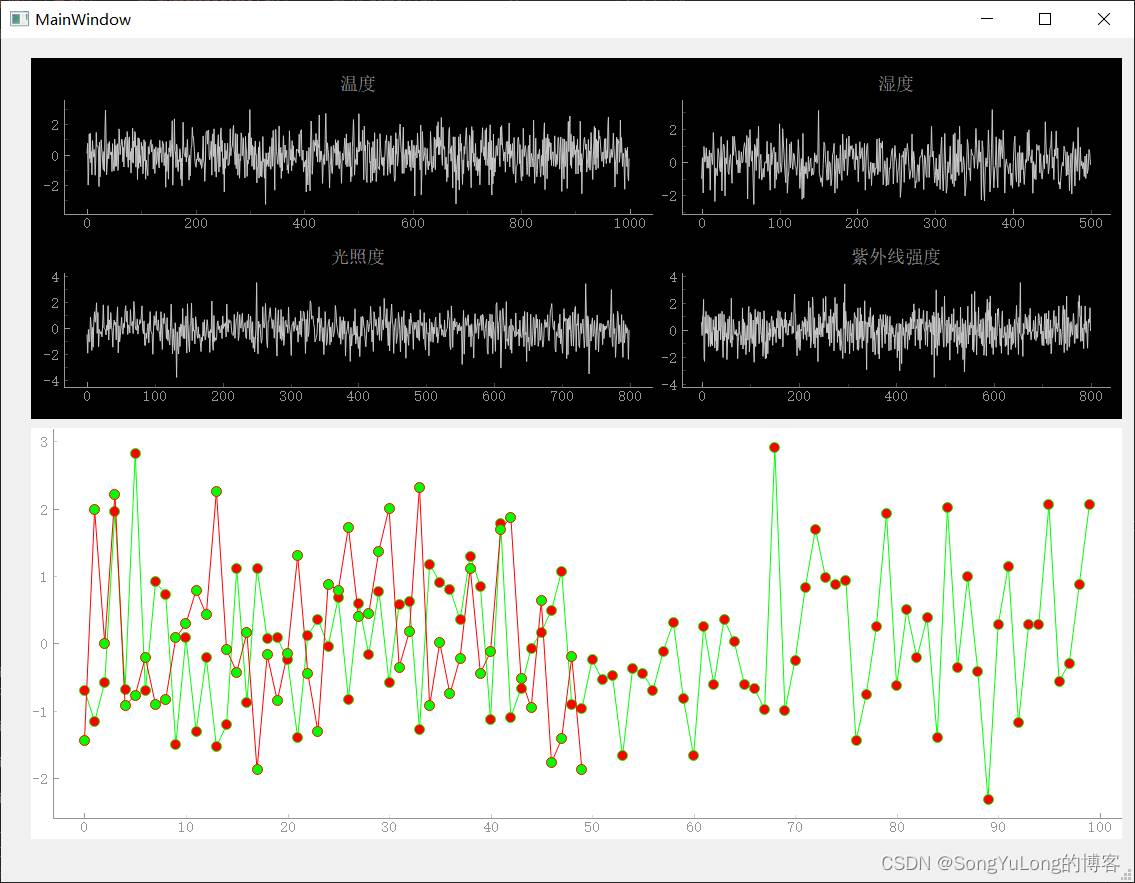
# 在QWidget控件提升为pyqtgraph.GraphicsLayoutWidget类型的控件上画波形 def drawGraphicsLayoutWidget(self): # pyqtgraph.GraphicsLayoutWidget 支持的方法有: # ['nextRow', 'nextCol', 'nextColumn', 'addPlot', 'addViewBox', 'addItem', 'getItem', 'addLayout', 'addLabel', 'removeItem', 'itemIndex', 'clear'] self.graphicsLayout.clear() # 清除 plt1 = self.graphicsLayout.addPlot(y=np.random.normal(size=1000), title="温度") plt2 = self.graphicsLayout.addPlot(y=np.random.normal(size=500), title="湿度") self.graphicsLayout.nextRow() # 图像坐标换行 plt3 = self.graphicsLayout.addPlot(y=np.random.normal(size=800), title="光照度") plt4 = self.graphicsLayout.addPlot(y=np.random.normal(size=800), title="紫外线强度")
# 在QWidget控件提升为pyqtgraph.PlotWidget类型的控件上画波形 def drawPoltWidget(self): # pyqtgraph.PlotWidget 支持的方法有: # ['addItem', 'removeItem', 'autoRange', 'clear', 'setAxisItems', 'setXRange', # 'setYRange', 'setRange', 'setAspectLocked', 'setMouseEnabled', # 'setXLink', 'setYLink', 'enableAutoRange', 'disableAutoRange', # 'setLimits', 'register', 'unregister', 'viewRect']
# pen = pg.mkPen(255, 0, 0) # pen = pg.mkPen("#ff0000") # pen = pg.mkPen(color='r', width=3) pen = pg.mkPen({'color':'0F0', 'width':1}) plt1 = self.graphPlot.plot(np.random.normal(size=100), pen=pen, symbolBrush=(255, 0, 0), symbolPen=(0, 255, 0))
pen2 = pg.mkPen(color="F00", width=1) plt2 = self.graphPlot.plot(np.random.normal(size=50), pen=pen2, symbolBrush=(0, 255, 0), symbolPen=(255, 0, 0))
self.graphPlot.setAntialiasing(True) self.graphPlot.setBackground("#ffffff")
if __name__ == "__main__": app = QApplication(sys.argv) win = GraphDemowWindow() win.show() sys.exit(app.exec_()) |
UI界面设计
包含了两个QWidget控件也可以是QGraphicsView控件类型。
两个控件分别提升为pyqtgraph.GraphicsLayoutWidget类型和pyqtgraph.PlotWidget
GraphicsLayoutWidget类型通过addPlot方法添加波形数据,每个波形都占有独立的区域。
|
1 2 |
plt1 = self.graphicsLayout.addPlot(y=np.random.normal(size=1000), title=“温度”) plt2 = self.graphicsLayout.addPlot(y=np.random.normal(size=500), title=“湿度”) |
PlotWidget类型通过plot方法添加波形数据,同一控件内多个plot占用同一窗口区域。
|
1 2 |
pen2 = pg.mkPen(color=“F00”, width=1) plt2 = self.graphPlot.plot(np.random.normal(size=50), pen=pen2, symbolBrush=(0, 255, 0), symbolPen=(255, 0, 0)) |
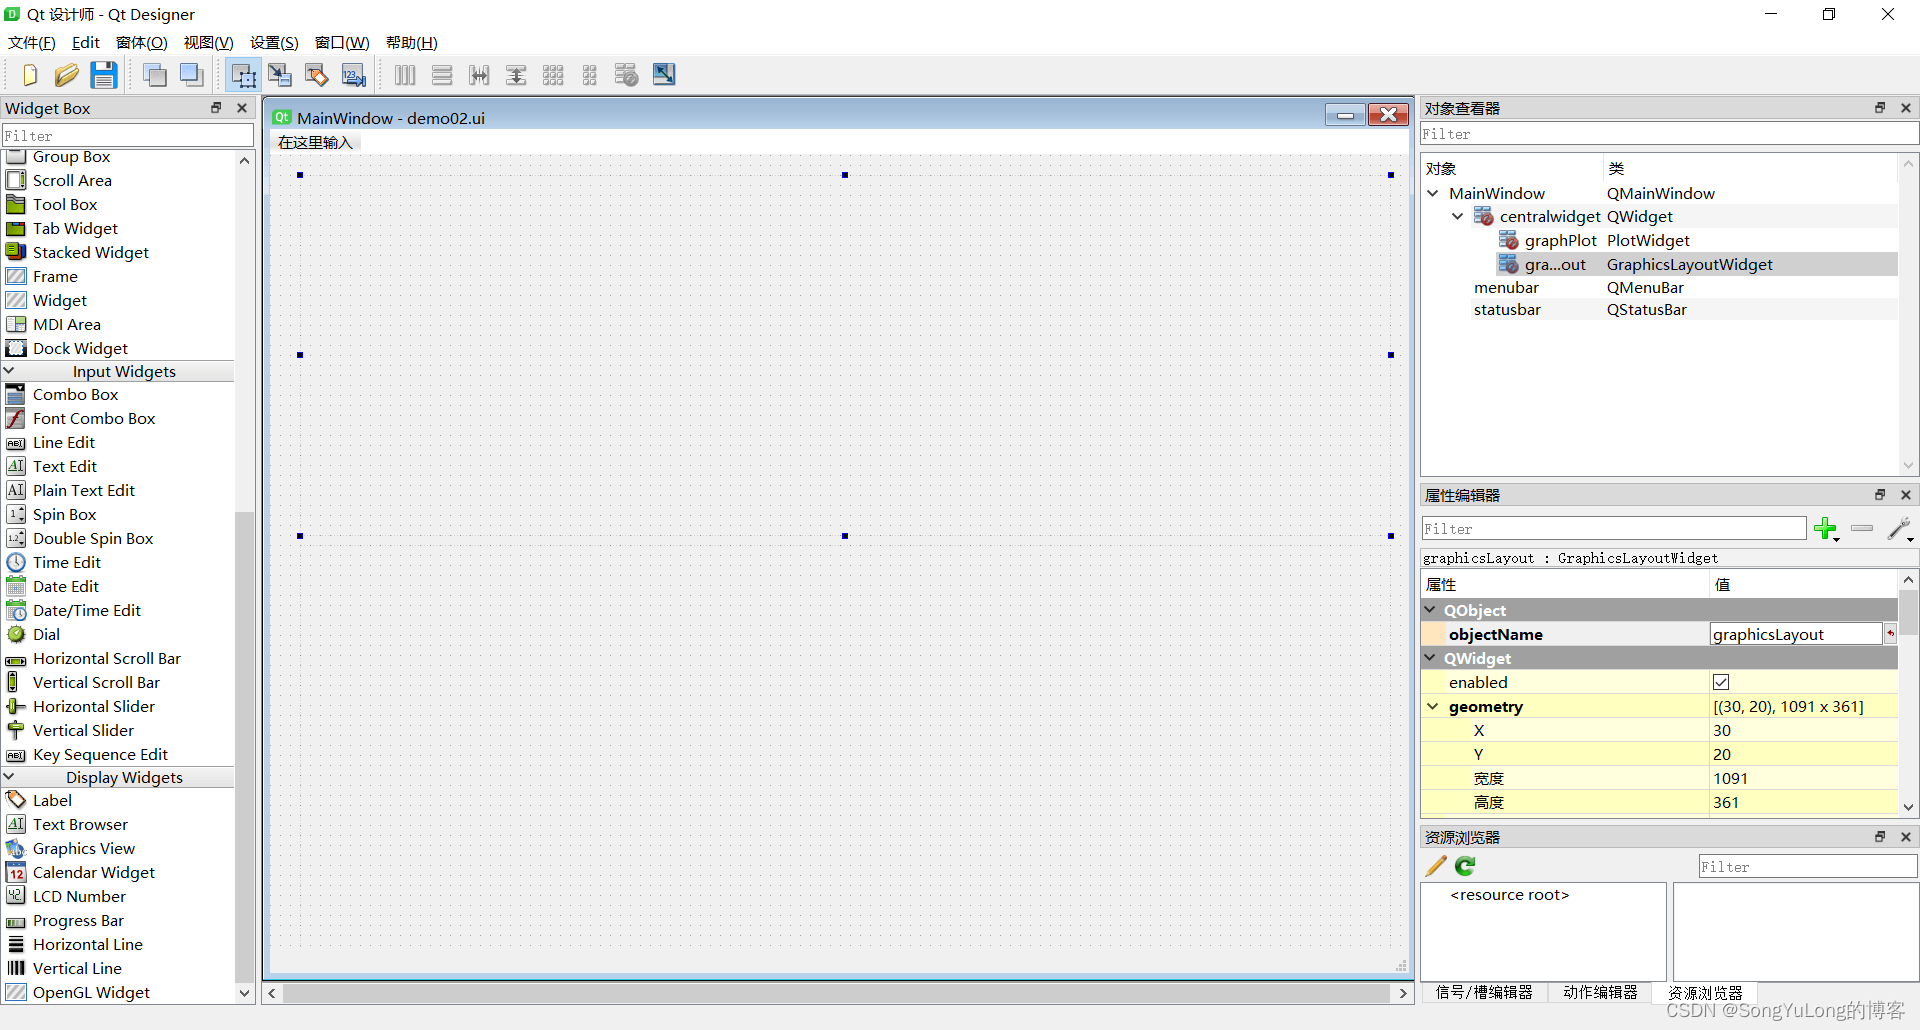
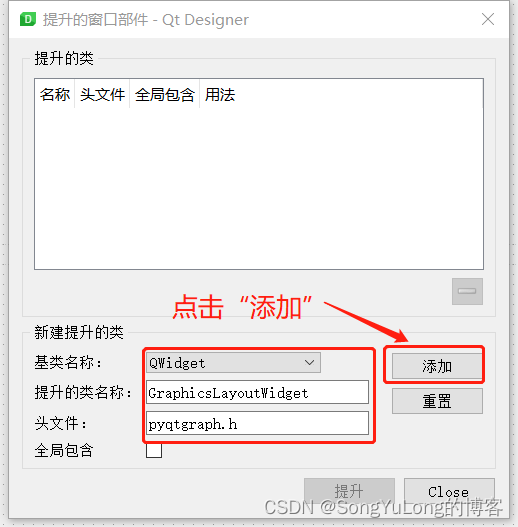
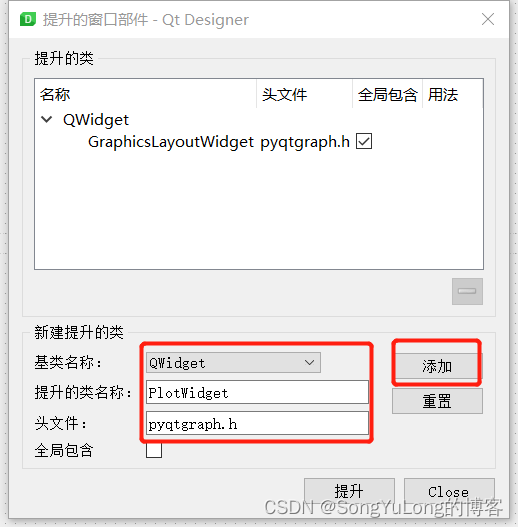
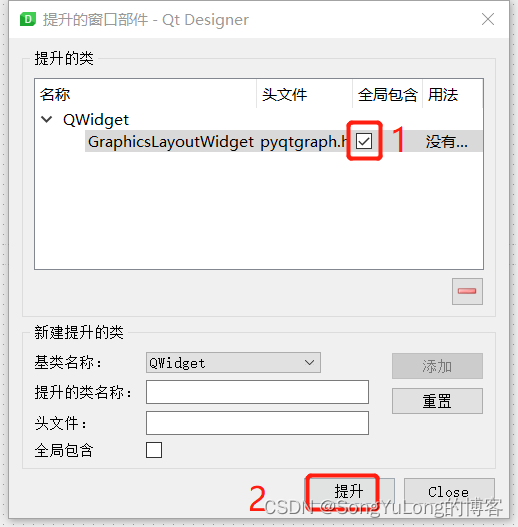
控件提升
UI设计文件
|
1 2 3 4 5 6 7 8 9 10 11 12 13 14 15 16 17 18 19 20 21 22 23 24 25 26 27 28 29 30 31 32 33 34 35 36 37 38 39 40 41 42 43 44 45 46 47 48 49 50 51 52 53 54 55 56 57 58 59 60 61 62 63 64 65 66 |
<?xml version="1.0" encoding="UTF-8"?> <ui version="4.0"> <class>MainWindow</class> <widget class="QMainWindow" name="MainWindow"> <property name="geometry"> <rect> <x>0</x> <y>0</y> <width>1139</width> <height>844</height> </rect> </property> <property name="windowTitle"> <string>MainWindow</string> </property> <widget class="QWidget" name="centralwidget"> <widget class="GraphicsLayoutWidget" name="graphicsLayout" native="true"> <property name="geometry"> <rect> <x>30</x> <y>20</y> <width>1091</width> <height>361</height> </rect> </property> </widget> <widget class="PlotWidget" name="graphPlot" native="true"> <property name="geometry"> <rect> <x>30</x> <y>390</y> <width>1091</width> <height>411</height> </rect> </property> </widget> </widget> <widget class="QMenuBar" name="menubar"> <property name="geometry"> <rect> <x>0</x> <y>0</y> <width>1139</width> <height>26</height> </rect> </property> </widget> <widget class="QStatusBar" name="statusbar"/> </widget> <customwidgets> <customwidget> <class>GraphicsLayoutWidget</class> <extends>QWidget</extends> <header location="global">pyqtgraph.h</header> <container>1</container> </customwidget> <customwidget> <class>PlotWidget</class> <extends>QWidget</extends> <header location="global">pyqtgraph.h</header> <container>1</container> </customwidget> </customwidgets> <resources/> <connections/> </ui> |
UI生成文件
|
1 2 3 4 5 6 7 8 9 10 11 12 13 14 15 16 17 18 19 20 21 22 23 24 25 26 27 28 29 30 31 32 33 34 35 36 37 38 39 40 41 |
# -*- coding: utf-8 -*-
# Form implementation generated from reading ui file 'd:\project\python\pyqtgraph\PygraphDemo2\demo02.ui' # # Created by: PyQt5 UI code generator 5.15.7 # # WARNING: Any manual changes made to this file will be lost when pyuic5 is # run again. Do not edit this file unless you know what you are doing.
from PyQt5 import QtCore, QtGui, QtWidgets
class Ui_MainWindow(object): def setupUi(self, MainWindow): MainWindow.setObjectName("MainWindow") MainWindow.resize(1139, 844) self.centralwidget = QtWidgets.QWidget(MainWindow) self.centralwidget.setObjectName("centralwidget") self.graphicsLayout = GraphicsLayoutWidget(self.centralwidget) self.graphicsLayout.setGeometry(QtCore.QRect(30, 20, 1091, 361)) self.graphicsLayout.setObjectName("graphicsLayout") self.graphPlot = PlotWidget(self.centralwidget) self.graphPlot.setGeometry(QtCore.QRect(30, 390, 1091, 411)) self.graphPlot.setObjectName("graphPlot") MainWindow.setCentralWidget(self.centralwidget) self.menubar = QtWidgets.QMenuBar(MainWindow) self.menubar.setGeometry(QtCore.QRect(0, 0, 1139, 26)) self.menubar.setObjectName("menubar") MainWindow.setMenuBar(self.menubar) self.statusbar = QtWidgets.QStatusBar(MainWindow) self.statusbar.setObjectName("statusbar") MainWindow.setStatusBar(self.statusbar)
self.retranslateUi(MainWindow) QtCore.QMetaObject.connectSlotsByName(MainWindow)
def retranslateUi(self, MainWindow): _translate = QtCore.QCoreApplication.translate MainWindow.setWindowTitle(_translate("MainWindow", "MainWindow")) from pyqtgraph import GraphicsLayoutWidget, PlotWidget |
运行效果