本篇文章介绍Ajax+Jpgraph实现的动态折线图功能的教程。
1, 代码
fun.js:
index.php:
img.php:
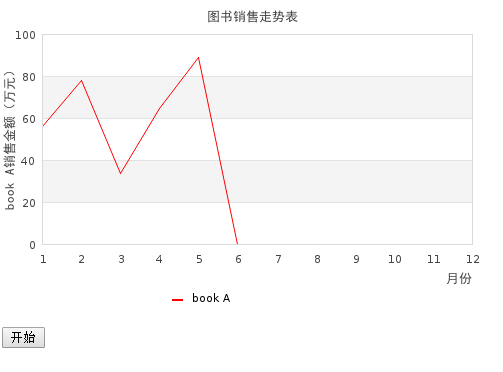
二 运行结果
1, 代码
fun.js:
var i=1;
function progress(){
  setInterval("beginProgress()", 600);
}
function beginProgress(){
 $("#img").attr("src", "img.php?m="+i);
 i++;
 if(i>=12){
   i=1;
 }
}
|
index.php:
<!DOCTYPE html PUBLIC "-//W3C//DTD XHTML 1.0 Transitional//EN" "http://www.w3.org/TR/xhtml1/DTD/xhtml1-transitional.dtd">
<html xmlns="http://www.w3.org/1999/xhtml">
<head>
<meta http-equiv="Content-Type" content="text/html; charset=gb2312" />
<title>Ajax+Jpgraph制作动态折线图</title>
</head>
<script language="javascript" src="js/jquery-1.3.2.js"></script>
<script language="javascript" src="js/fun.js"></script>
<body>
  <img id="img" src="img.php?m=0" />
 <br>
 <input type="button" value="开始" onclick="progress()"/>
</body>
</html>
|
img.php:
<?php
require_once 'src/jpgraph.php';   //导入Jpgraph类库
require_once 'src/jpgraph_line.php';   //导入Jpgraph类库的柱状图功能
$dataTmp = array(56, 78, 34, 65, 89, 24 ,67 ,88, 45, 68, 70, 50);   //设置统计数据
$data1 = array(0, 0, 0, 0, 0, 0 ,0 ,0, 0, 0, 0, 0);   //设置统计数据
$m = $_GET['m'];
for($i=0; $i<$m; $i++){
  $data1[$i] = $dataTmp[$i];
}
$graph = new Graph(500, 320);
$graph->SetScale("textlin");
$graph->SetShadow();
$graph->img->SetMargin(40, 30, 30, 70);
$graph->title->Set("图书销售走势表");
$lineplot1 = new LinePlot($data1);
$graph->Add($lineplot1);
$graph->xaxis->title->Set("月份");
$graph->yaxis->title->Set("book A销售金额(万元)");
$graph->title->SetFont(FF_SIMSUN, FS_BOLD);
$graph->yaxis->title->SetFont(FF_SIMSUN, FS_BOLD);
$graph->xaxis->title->SetFont(FF_SIMSUN, FS_BOLD);
$lineplot1->SetColor('red');
$lineplot1->SetLegend('book A');
$graph->legend->SetLayout(LEGEND_HOR);
$graph->legend->Pos(0.4, 0.95, 'center', 'bottom');
$graph->Stroke();
|
二 运行结果
原文链接:
相关文章