灰度图显示为伪彩色图
法一
import matplotlib.pyplot as plt

img = plt.imread('C:/Users/leex/Desktop/lena.jpg')
img_s = img[:,:,0]# 直接读入的img为3通道,这里用直接赋值的方法转为单通道
sc = plt.imshow(img_s)
sc.set_cmap('hot')# 这里可以设置多种模式
plt.colorbar()# 显示色度条
|
效果

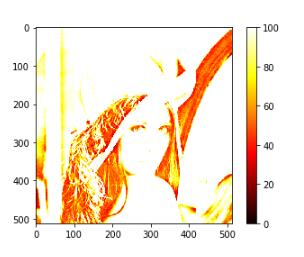
限制范围
import matplotlib.pyplot as plt

img = plt.imread('C:/Users/leex/Desktop/lena.jpg')
img_s = img[:,:,0]
sc = plt.imshow(img_s)
sc.set_cmap('hot')
sc.set_clim(0,100)
plt.colorbar()
|
效果
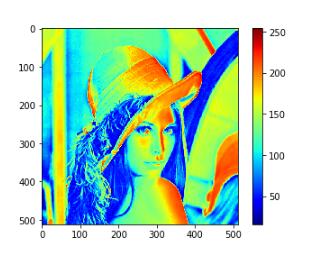
法二
import matplotlib.pyplot as plt

img = plt.imread('C:/Users/leex/Desktop/lena.jpg')
img_s = img[:,:,0]
sc = plt.imshow(img_s, cmap = plt.cm.jet)# 设置cmap为RGB图
plt.colorbar()# 显示色度条
|
效果
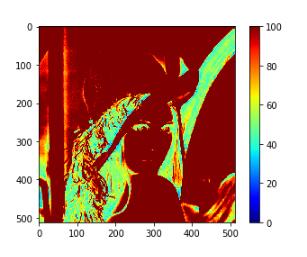
限制范围
import matplotlib.pyplot as plt

img = plt.imread('C:/Users/leex/Desktop/lena.jpg')
img_s = img[:,:,0]
sc = plt.imshow(img_s, vmin=0, vmax = 100, cmap = plt.cm.jet)# 限制范围为0-100
plt.colorbar()
|
效果
原文链接:https://blog.csdn.net/sjtuxx_lee/article/details/82628496
相关文章