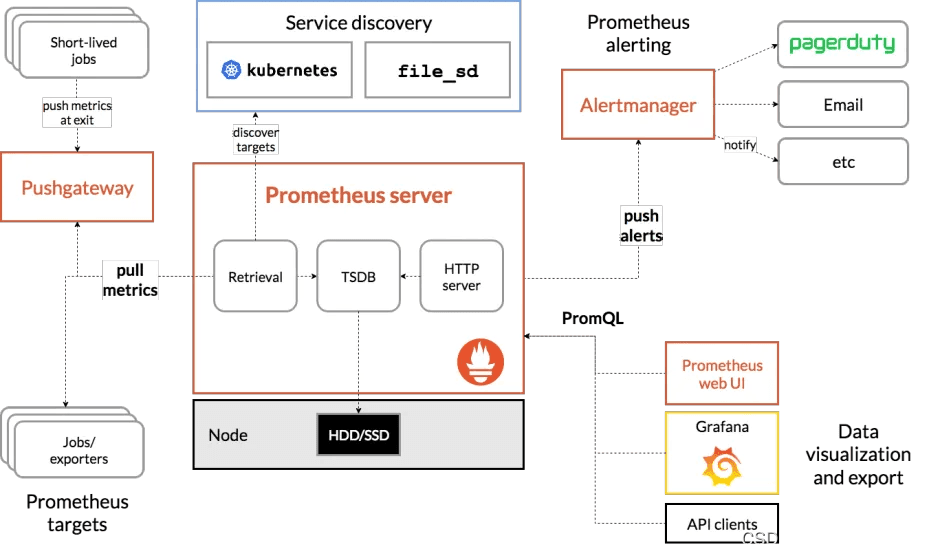
一、Pushgateway概述 1.1 Pushgateway简介 Pushgateway是prometheus的一个组件,prometheus server默认是通过exporter主动获取数据(默认采取pull拉取数据),pushgateway则是通过被动方式推送数据到prometheus server,
一、Pushgateway概述1.1 Pushgateway简介Pushgateway是prometheus的一个组件,prometheus server默认是通过exporter主动获取数据(默认采取pull拉取数据),pushgateway则是通过被动方式推送数据到prometheus server,用户可以写一些自定义的监控脚本把需要监控的数据发送给pushgateway, 然后pushgateway再把数据发送给Prometheus server。
1.2 Pushgateway优点
1.3 pushgateway缺点
二、测试环境
三、安装测试3.1 pushgateway安装在node1节点操作
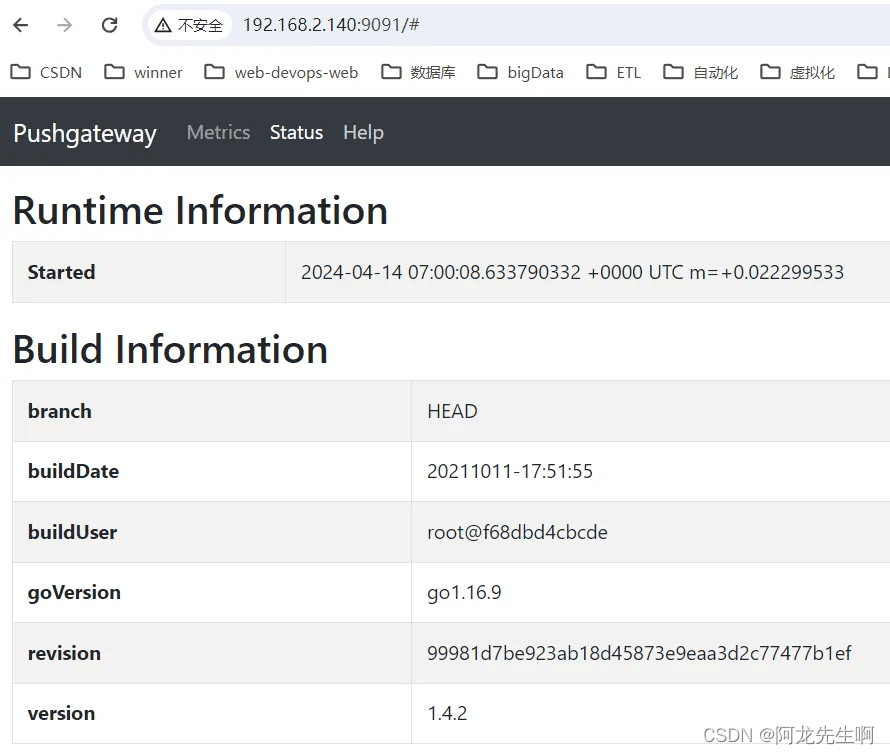
在浏览器访问192.168.2.140:9091出现如下ui界面
3.2 prometheus添加pushgateway修改prometheus-cfg.yaml文件
更新
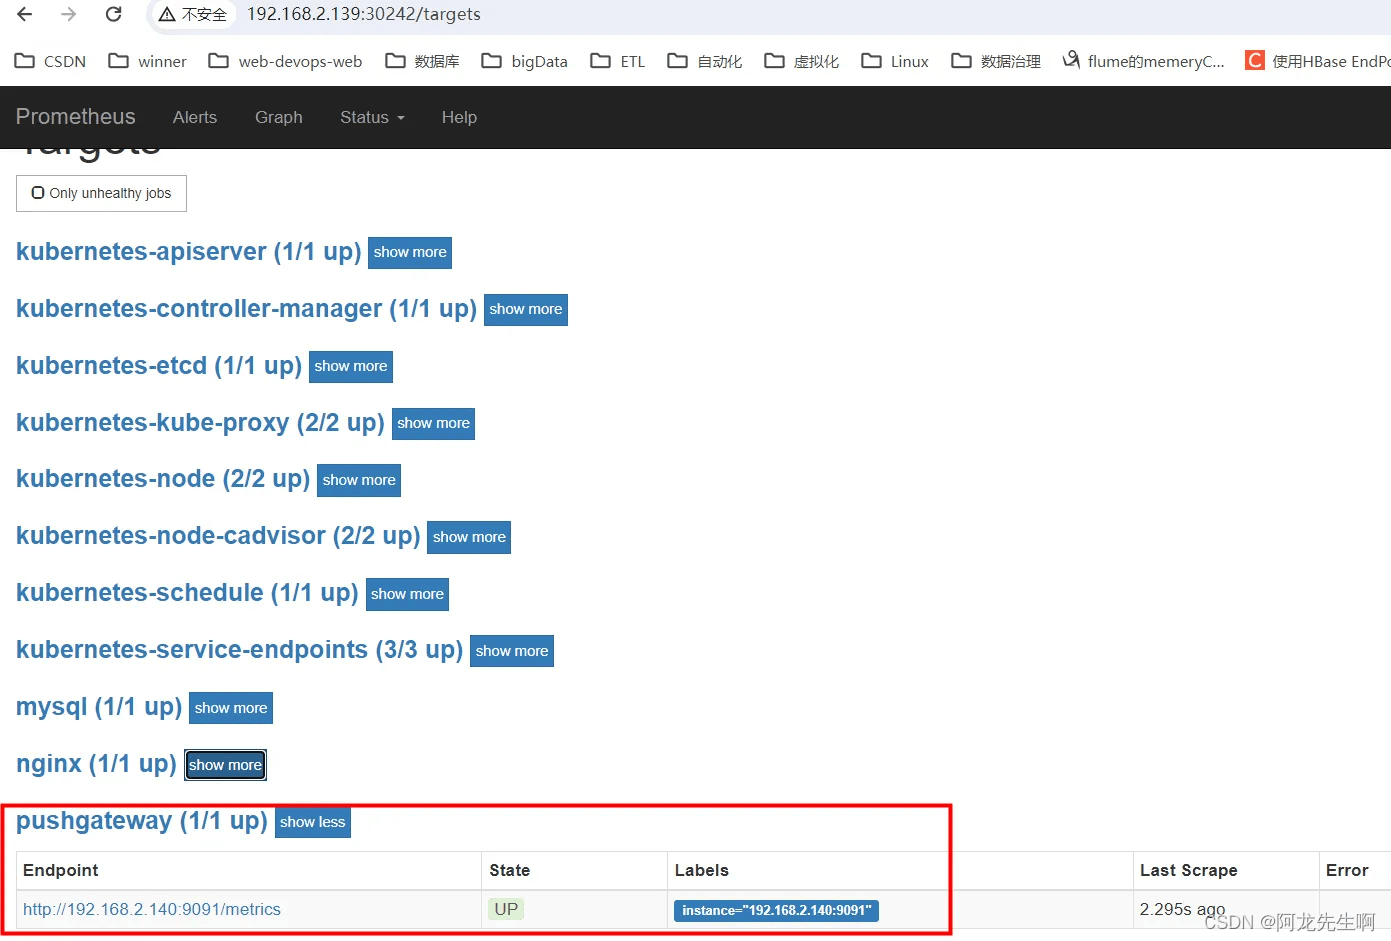
登录prometheus http://192.168.2.139:30242/targets
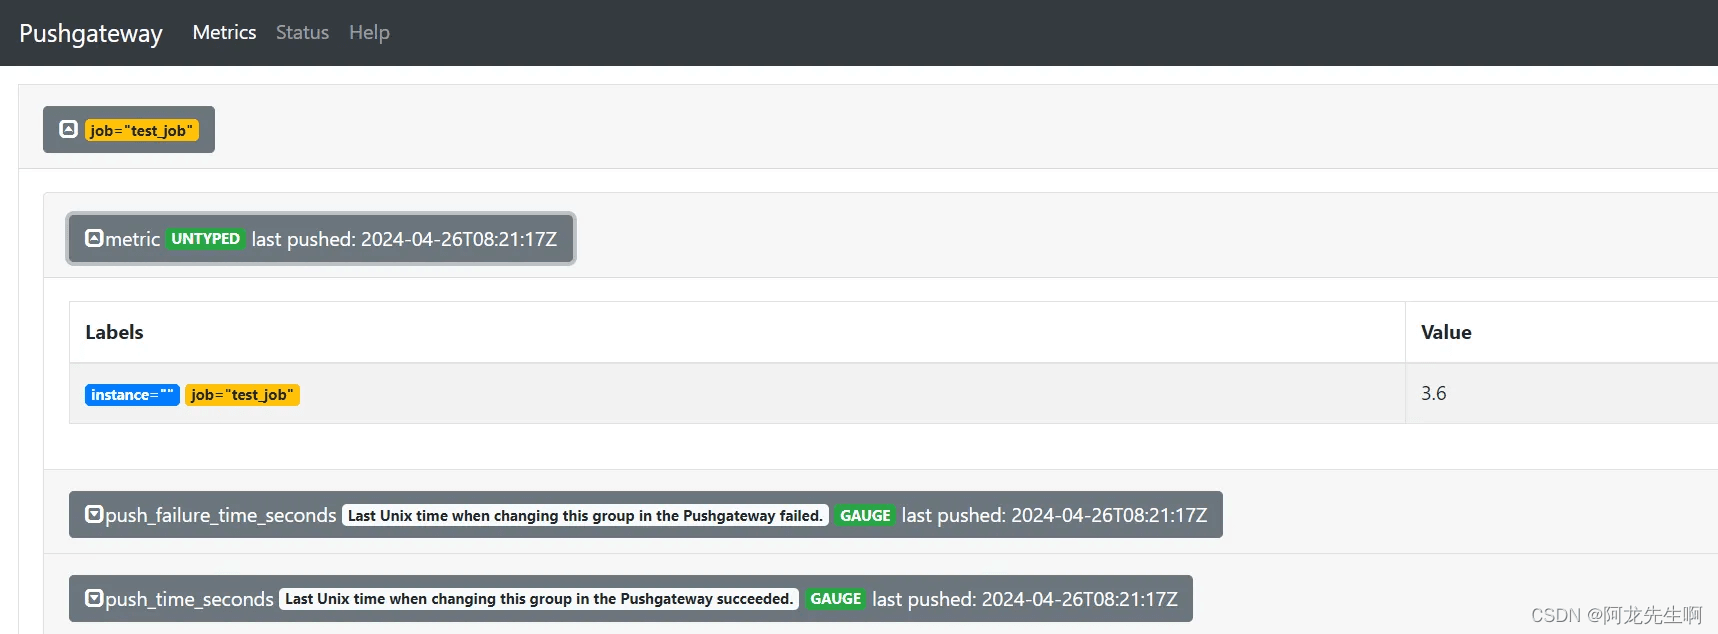
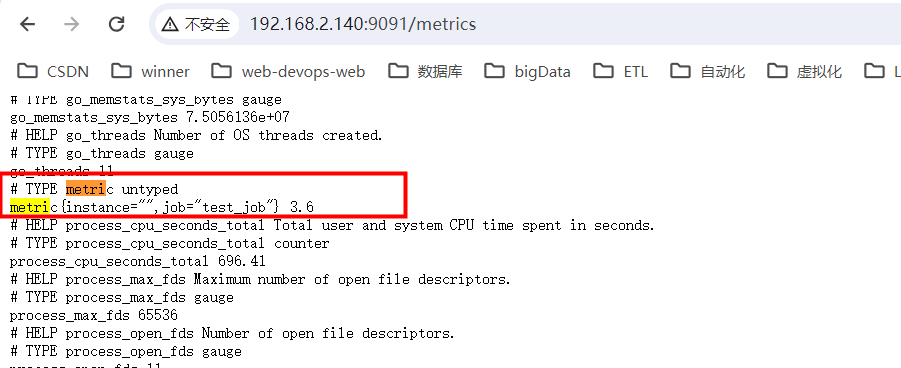
3.3 推送指定的数据格式到pushgateway1.添加单条数据
这里需要注意的是将<key & value>推送给pushgateway,curl --data-binary是将HTTP POST请求中的数据发送给HTTP服务器(pushgateway),和用户提交THML表单时浏览器的行为是一样的,HTTP POST请求中的数据为纯二进制数据。
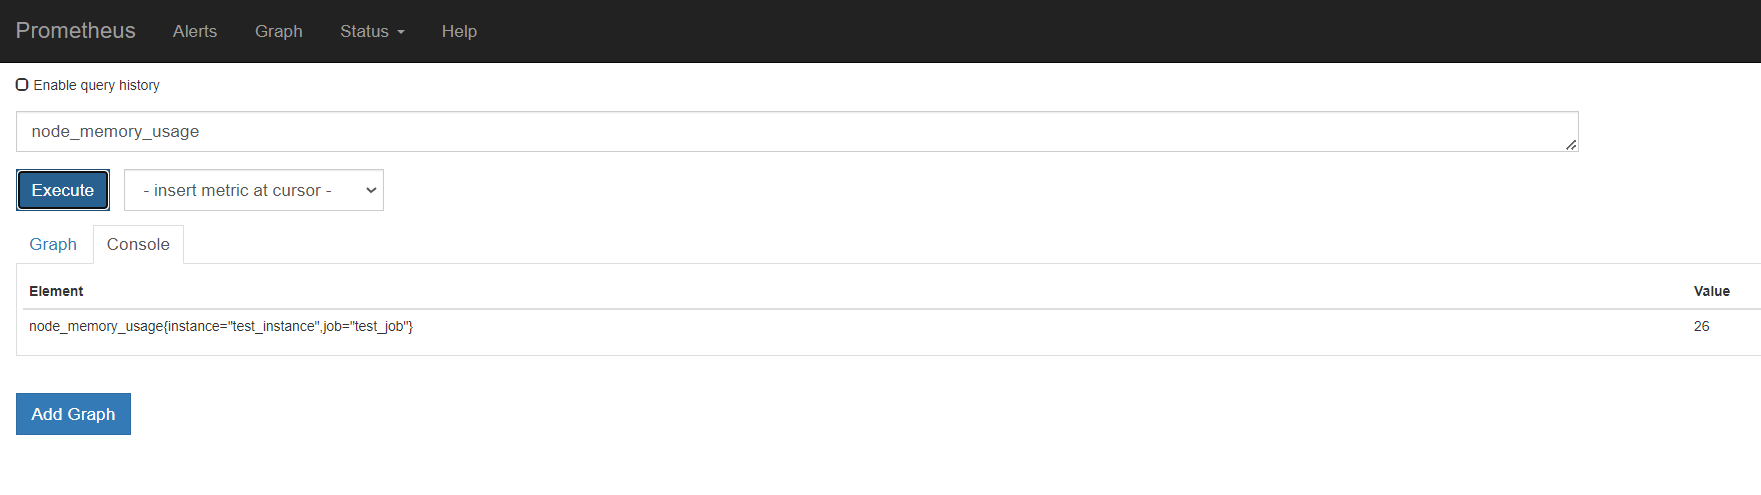
prometheus web中查询
2.添加复杂数据
这条连接主要分为三个部分:
如下是删除某个实例
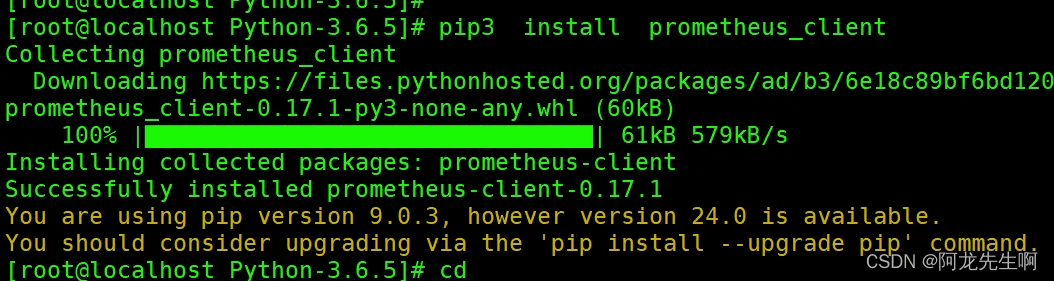
3.SDk-prometheus-client使用python安装 prometheus_client 使用 pip 工具可以非常方便地安装 prometheus_client:
测试脚本
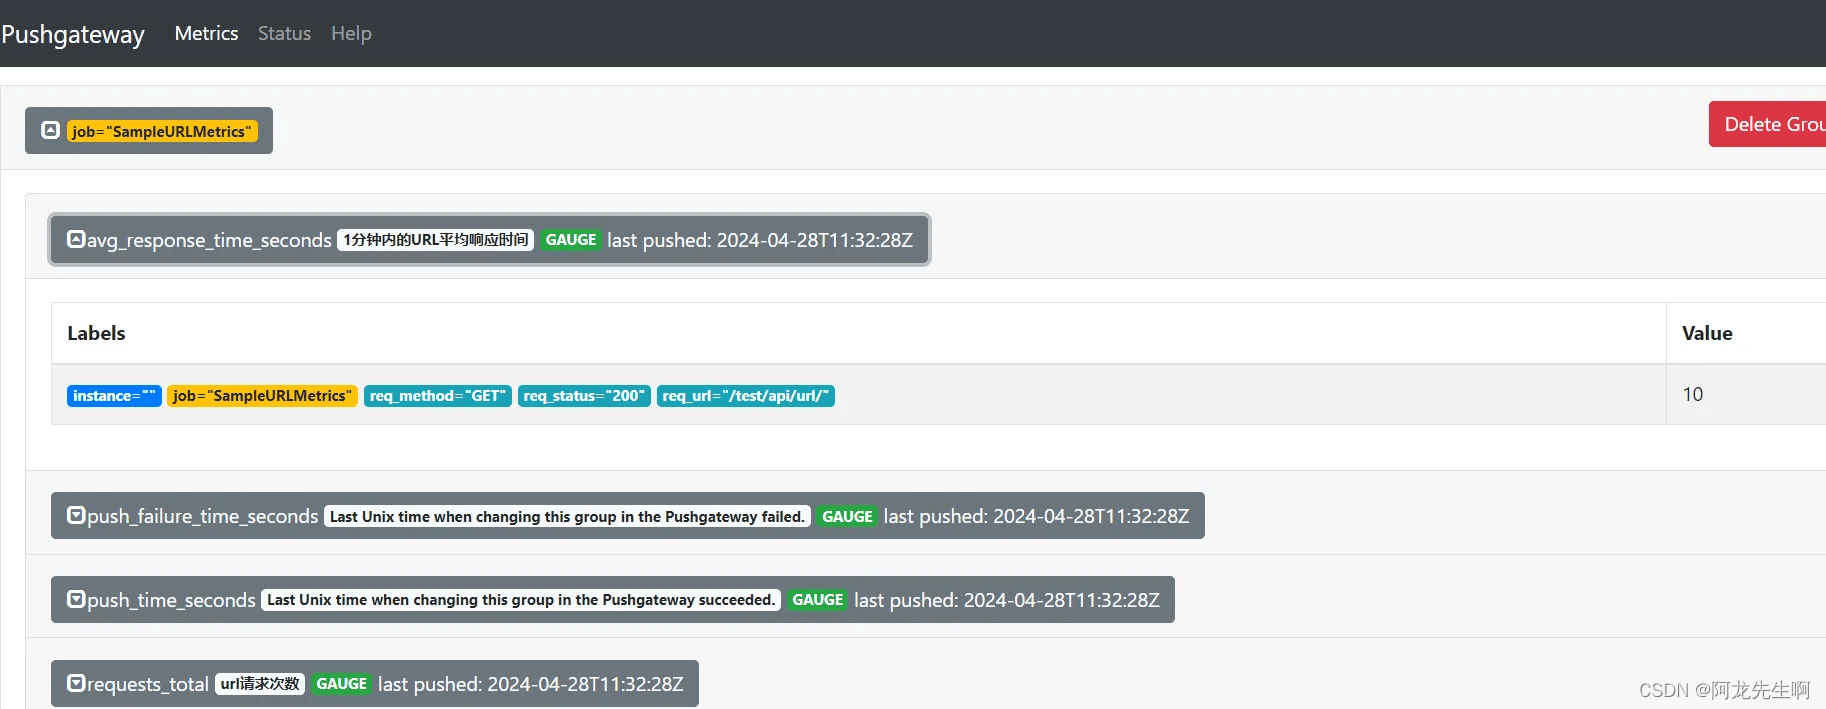
在这个示例中,我们定义了一个名为requests_total的指标,记录了一个值为1和10的示例数据,并将指标数据推送到了名为example_job的job中。
|


2022-04-23
2023-04-23
2024-04-08
2022-10-16
2024-03-08