广告位联系
返回顶部
分享到

PyQt5使用pyqtgraph绘制波形图

python 来源:互联网 作者:佚名 发布时间:2023-01-15 21:54:20 人浏览
摘要

主程序代码 1 2 3 4 5 6 7 8 9 10 11 12 13 14 15 16 17 18 19 20 21 22 23 24 25 26 27 28 29 30 31 32 33 34 35 36 37 38 39 40 41 42 43 44 45 46 47 48 49 50 51 52 53 54 55 56 57 58 59 60 61 62 import sys import numpy as np from PyQt5.QtGui

主程序代码

1

2

3

4

5

6

7

8

9

10

11

12

13

14

15

16

17

18

19

20

21

22

23

24

25

26

27

28

29

30

31

32

33

34

35

36

37

38

39

40

41

42

43

44

45

46

47

48

49

50

51

52

53

54

55

56

57

58

59

60

61

62

import sys

import numpy as np

from PyQt5.QtGui import *

from PyQt5.QtCore import *

from PyQt5.QtWidgets import *


import pyqtgraph as pg


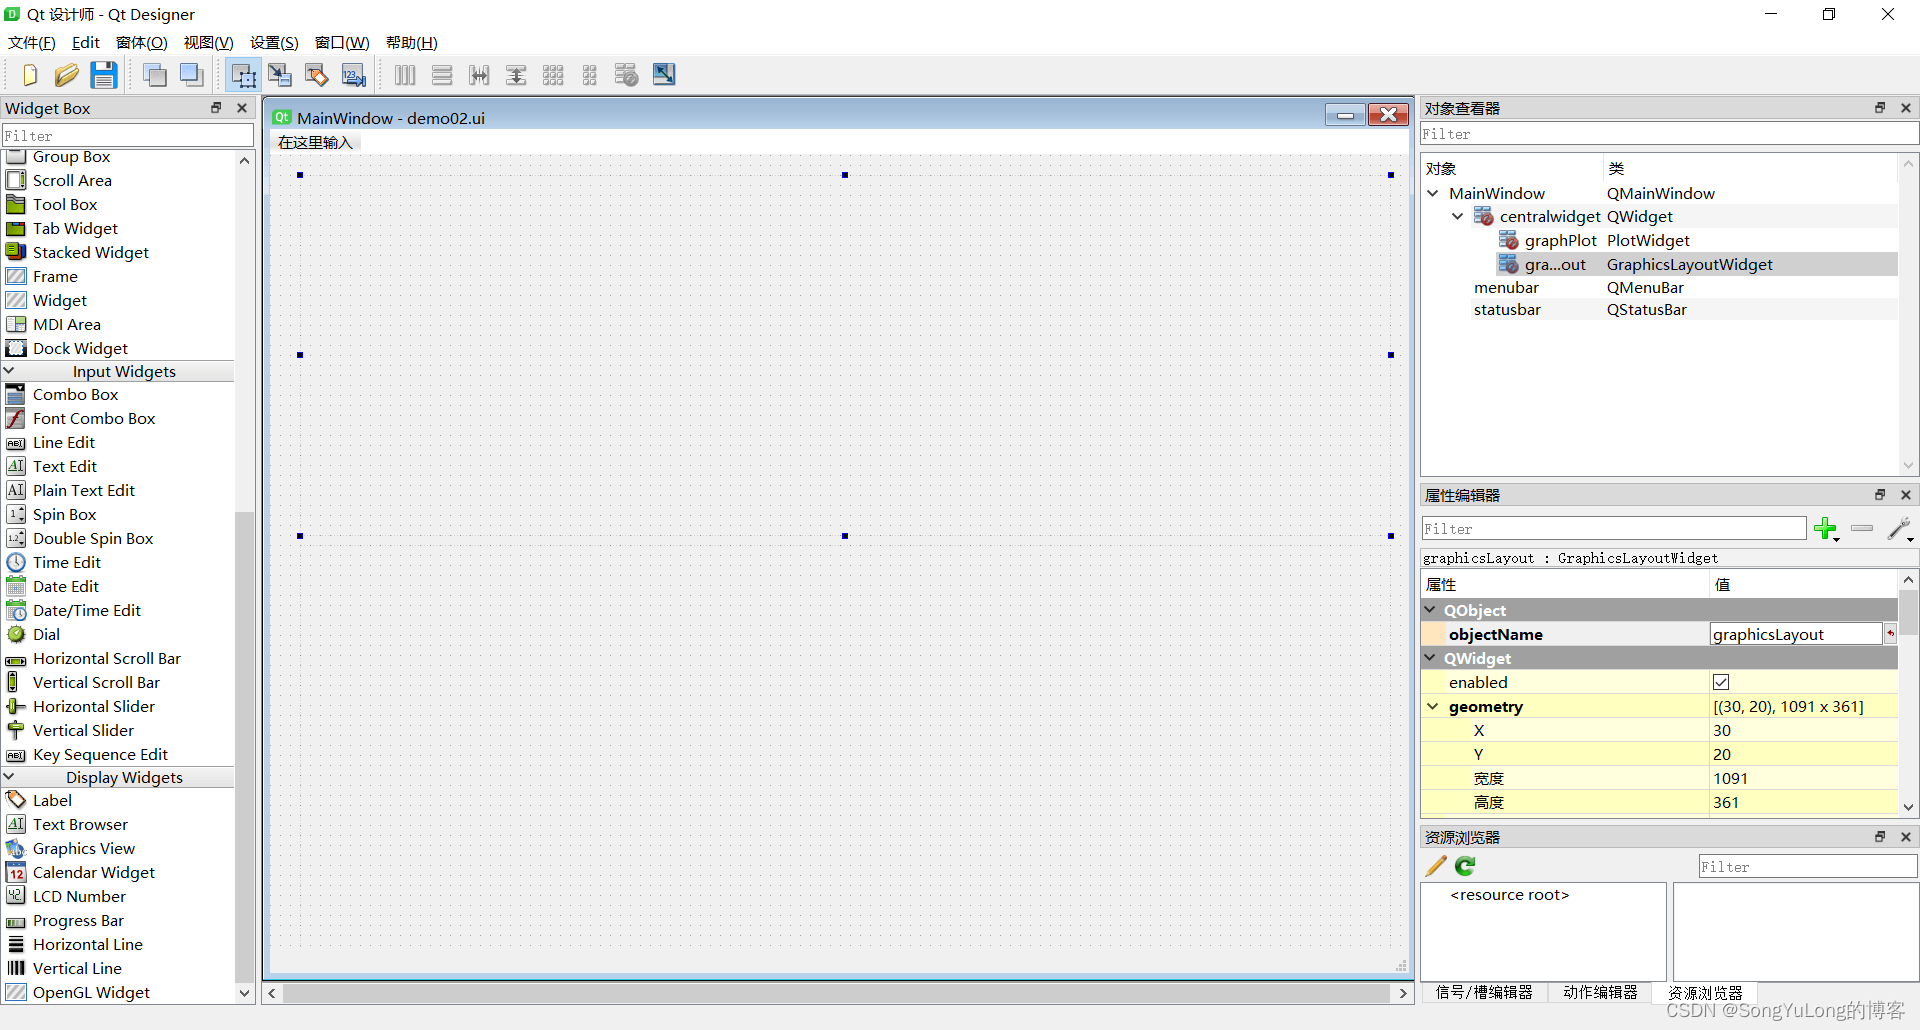
from ui_demo02 import Ui_MainWindow


class GraphDemowWindow(QMainWindow, Ui_MainWindow):

    def __init__(self, parent=None):

        super(GraphDemowWindow, self).__init__(parent)

        self.setupUi(self)


        pg.setConfigOptions(antialias=True) # 设置开启抗锯齿


        self.drawGraphicsLayoutWidget()

        self.drawPoltWidget()


    # 在QWidget控件提升为pyqtgraph.GraphicsLayoutWidget类型的控件上画波形

    def drawGraphicsLayoutWidget(self):

        # pyqtgraph.GraphicsLayoutWidget 支持的方法有:

        # ['nextRow', 'nextCol', 'nextColumn', 'addPlot', 'addViewBox', 'addItem', 'getItem', 'addLayout', 'addLabel', 'removeItem', 'itemIndex', 'clear']

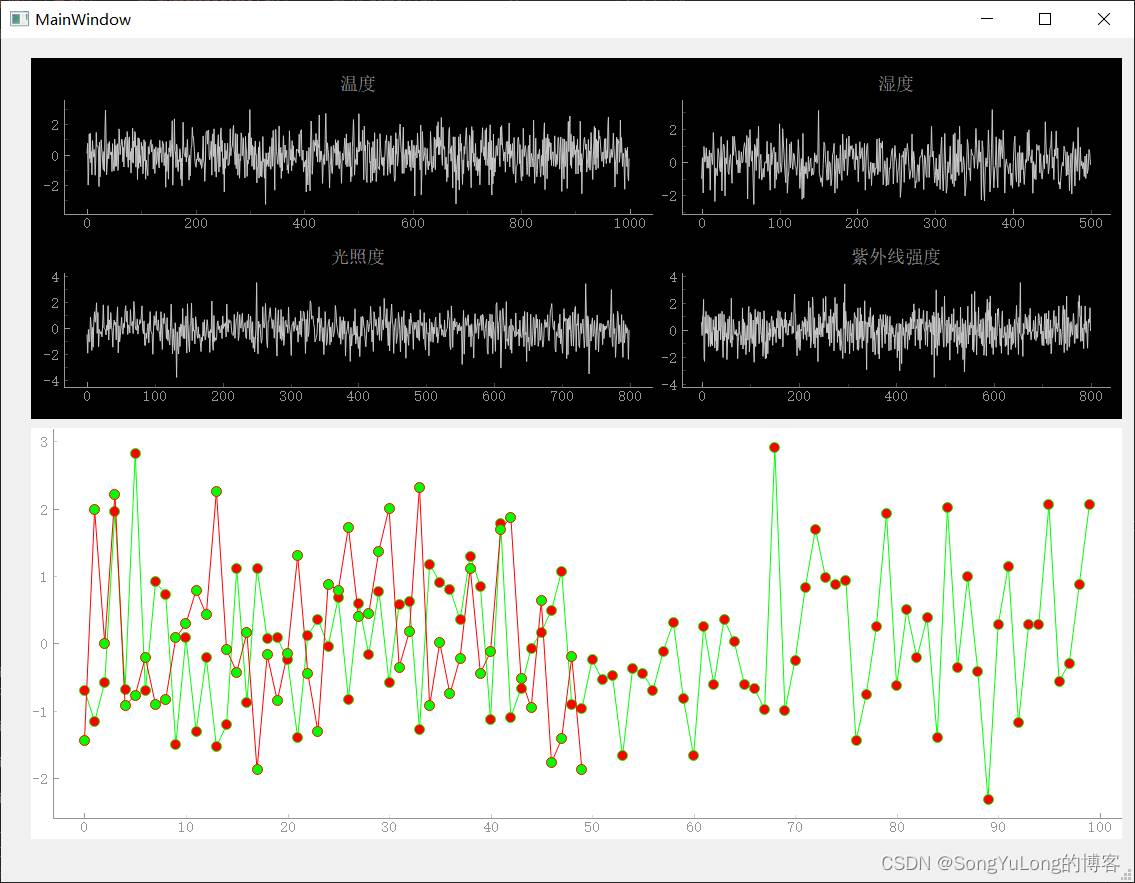
        self.graphicsLayout.clear() # 清除

        plt1 = self.graphicsLayout.addPlot(y=np.random.normal(size=1000), title="温度")

        plt2 = self.graphicsLayout.addPlot(y=np.random.normal(size=500), title="湿度")

        self.graphicsLayout.nextRow() # 图像坐标换行

        plt3 = self.graphicsLayout.addPlot(y=np.random.normal(size=800), title="光照度")

        plt4 = self.graphicsLayout.addPlot(y=np.random.normal(size=800), title="紫外线强度")


    # 在QWidget控件提升为pyqtgraph.PlotWidget类型的控件上画波形

    def drawPoltWidget(self):

        # pyqtgraph.PlotWidget 支持的方法有:

        # ['addItem', 'removeItem', 'autoRange', 'clear', 'setAxisItems', 'setXRange',

        #           'setYRange', 'setRange', 'setAspectLocked', 'setMouseEnabled',

        #           'setXLink', 'setYLink', 'enableAutoRange', 'disableAutoRange',

        #           'setLimits', 'register', 'unregister', 'viewRect']


        # pen = pg.mkPen(255, 0, 0)

        # pen = pg.mkPen("#ff0000")

        # pen = pg.mkPen(color='r', width=3)

        pen = pg.mkPen({'color':'0F0', 'width':1})

        plt1 = self.graphPlot.plot(np.random.normal(size=100), pen=pen,  symbolBrush=(255, 0, 0), symbolPen=(0, 255, 0))


        pen2 = pg.mkPen(color="F00", width=1)

        plt2 = self.graphPlot.plot(np.random.normal(size=50), pen=pen2,  symbolBrush=(0, 255, 0), symbolPen=(255, 0, 0))


        self.graphPlot.setAntialiasing(True)

        self.graphPlot.setBackground("#ffffff")


if __name__ == "__main__":

    app = QApplication(sys.argv)

    win = GraphDemowWindow()

    win.show()

    sys.exit(app.exec_())

UI界面设计

包含了两个QWidget控件也可以是QGraphicsView控件类型。

两个控件分别提升为pyqtgraph.GraphicsLayoutWidget类型和pyqtgraph.PlotWidget

GraphicsLayoutWidget类型通过addPlot方法添加波形数据,每个波形都占有独立的区域。

1

2

plt1 = self.graphicsLayout.addPlot(y=np.random.normal(size=1000), title=“温度”)

plt2 = self.graphicsLayout.addPlot(y=np.random.normal(size=500), title=“湿度”)

PlotWidget类型通过plot方法添加波形数据,同一控件内多个plot占用同一窗口区域。

1

2

pen2 = pg.mkPen(color=“F00”, width=1)

plt2 = self.graphPlot.plot(np.random.normal(size=50), pen=pen2, symbolBrush=(0, 255, 0), symbolPen=(255, 0, 0))

控件提升

UI设计文件

1

2

3

4

5

6

7

8

9

10

11

12

13

14

15

16

17

18

19

20

21

22

23

24

25

26

27

28

29

30

31

32

33

34

35

36

37

38

39

40

41

42

43

44

45

46

47

48

49

50

51

52

53

54

55

56

57

58

59

60

61

62

63

64

65

66

<?xml version="1.0" encoding="UTF-8"?>

<ui version="4.0">

 <class>MainWindow</class>

 <widget class="QMainWindow" name="MainWindow">

  <property name="geometry">

   <rect>

    <x>0</x>

    <y>0</y>

    <width>1139</width>

    <height>844</height>

   </rect>

  </property>

  <property name="windowTitle">

   <string>MainWindow</string>

  </property>

  <widget class="QWidget" name="centralwidget">

   <widget class="GraphicsLayoutWidget" name="graphicsLayout" native="true">

    <property name="geometry">

     <rect>

      <x>30</x>

      <y>20</y>

      <width>1091</width>

      <height>361</height>

     </rect>

    </property>

   </widget>

   <widget class="PlotWidget" name="graphPlot" native="true">

    <property name="geometry">

     <rect>

      <x>30</x>

      <y>390</y>

      <width>1091</width>

      <height>411</height>

     </rect>

    </property>

   </widget>

  </widget>

  <widget class="QMenuBar" name="menubar">

   <property name="geometry">

    <rect>

     <x>0</x>

     <y>0</y>

     <width>1139</width>

     <height>26</height>

    </rect>

   </property>

  </widget>

  <widget class="QStatusBar" name="statusbar"/>

 </widget>

 <customwidgets>

  <customwidget>

   <class>GraphicsLayoutWidget</class>

   <extends>QWidget</extends>

   <header location="global">pyqtgraph.h</header>

   <container>1</container>

  </customwidget>

  <customwidget>

   <class>PlotWidget</class>

   <extends>QWidget</extends>

   <header location="global">pyqtgraph.h</header>

   <container>1</container>

  </customwidget>

 </customwidgets>

 <resources/>

 <connections/>

</ui>

UI生成文件

1

2

3

4

5

6

7

8

9

10

11

12

13

14

15

16

17

18

19

20

21

22

23

24

25

26

27

28

29

30

31

32

33

34

35

36

37

38

39

40

41

# -*- coding: utf-8 -*-


# Form implementation generated from reading ui file 'd:\project\python\pyqtgraph\PygraphDemo2\demo02.ui'

#

# Created by: PyQt5 UI code generator 5.15.7

#

# WARNING: Any manual changes made to this file will be lost when pyuic5 is

# run again.  Do not edit this file unless you know what you are doing.


from PyQt5 import QtCore, QtGui, QtWidgets


class Ui_MainWindow(object):

    def setupUi(self, MainWindow):

        MainWindow.setObjectName("MainWindow")

        MainWindow.resize(1139, 844)

        self.centralwidget = QtWidgets.QWidget(MainWindow)

        self.centralwidget.setObjectName("centralwidget")

        self.graphicsLayout = GraphicsLayoutWidget(self.centralwidget)

        self.graphicsLayout.setGeometry(QtCore.QRect(30, 20, 1091, 361))

        self.graphicsLayout.setObjectName("graphicsLayout")

        self.graphPlot = PlotWidget(self.centralwidget)

        self.graphPlot.setGeometry(QtCore.QRect(30, 390, 1091, 411))

        self.graphPlot.setObjectName("graphPlot")

        MainWindow.setCentralWidget(self.centralwidget)

        self.menubar = QtWidgets.QMenuBar(MainWindow)

        self.menubar.setGeometry(QtCore.QRect(0, 0, 1139, 26))

        self.menubar.setObjectName("menubar")

        MainWindow.setMenuBar(self.menubar)

        self.statusbar = QtWidgets.QStatusBar(MainWindow)

        self.statusbar.setObjectName("statusbar")

        MainWindow.setStatusBar(self.statusbar)


        self.retranslateUi(MainWindow)

        QtCore.QMetaObject.connectSlotsByName(MainWindow)


    def retranslateUi(self, MainWindow):

        _translate = QtCore.QCoreApplication.translate

        MainWindow.setWindowTitle(_translate("MainWindow", "MainWindow"))

from pyqtgraph import GraphicsLayoutWidget, PlotWidget

运行效果


版权声明 : 本文内容来源于互联网或用户自行发布贡献,该文观点仅代表原作者本人。本站仅提供信息存储空间服务和不拥有所有权,不承担相关法律责任。如发现本站有涉嫌抄袭侵权, 违法违规的内容, 请发送邮件至2530232025#qq.cn(#换@)举报,一经查实,本站将立刻删除。
原文链接 : https://blog.csdn.net/songyulong8888/article/details/128664917
相关文章
  • Pandas读取csv的实现介绍
    对于文件的操作中,读写csv操作是一个比较常见的操作,很多时候可能会选择使用python中的文件读取的方式对csv文件操作,这种方式并没有
  • PyQt5使用pyqtgraph绘制波形图

    PyQt5使用pyqtgraph绘制波形图
    主程序代码 1 2 3 4 5 6 7 8 9 10 11 12 13 14 15 16 17 18 19 20 21 22 23 24 25 26 27 28 29 30 31 32 33 34 35 36 37 38 39 40 41 42 43 44 45 46 47 48 49 50 51 52 53 54 55 56 57 58
  • Python+Pygame编写一个Pong游戏

    Python+Pygame编写一个Pong游戏
    这次,我们要用Pygame写一个Pong游戏 先看看效果: 需要的模块:Pygame 在python文件同目录下新建resources文件夹,在文件夹中新建Pong文件夹,文
  • 简单有效上手Python3异步asyncio问题
    Python3异步asyncio问题 官方文档: https://docs.python.org/zh-cn/3/library/asyncio-task.html#asyncio.run 看了一大堆相关的资料和教程,针对的Python版本不同,
  • python提取xml指定内容的方法
    第一种方法:python操作xml文件 随手找了一个xml文件内容(jenkins相关文件) 1 2 3 4 5 6 7 8 9 10 11 12 13 14 15 16 17 18 19 20 21 22 23 24 25 26 27 28 29 30 31 32
  • 22个Python的万用公式总结分享

    22个Python的万用公式总结分享
    在大家的日常python程序的编写过程中,都会有自己解决某个问题的解决办法,或者是在程序的调试过程中,用来帮助调试的程序公式。 小编
  • Numpy np.array()函数使用方法指南
    1、Numpy ndarray对象 numpy ndarray对象是一个n维数组对象,ndarray只能存储一系列相同元素。 1 2 3 4 5 6 7 8 9 10 11 12 13 14 #一维数组 [1,2,3,4] #shape(4,
  • Python实战之天气预报系统的实现

    Python实战之天气预报系统的实现
    鼎鼎大名的南方城市长沙很早就入冬了,街上各种大衣,毛衣,棉衣齐齐出动。 这段时间全国各地大风呜呜地吹,很多地方断崖式降温。
  • vscode配置与python虚拟环境切换的几种方式
    1. 采用工作区设置默认解释器的方式(推荐) 下载完vscode,并安装python支持之后。使用vscode打开一个空文件夹。点击左侧的运行与调试,创
  • 用python获取到照片拍摄时的详细位置(附源码)
    先看获取到的效果 拍摄时间:2021:12:18 16:22:13 照片拍摄地址:(内蒙古自治区包头市昆都仑区, 内蒙古自治区, 包头市, 昆都仑区, 多米幼儿园东
  • 本站所有内容来源于互联网或用户自行发布,本站仅提供信息存储空间服务,不拥有版权,不承担法律责任。如有侵犯您的权益,请您联系站长处理!
  • Copyright © 2017-2022 F11.CN All Rights Reserved. F11站长开发者网 版权所有 | 苏ICP备2022031554号-1 | 51LA统计