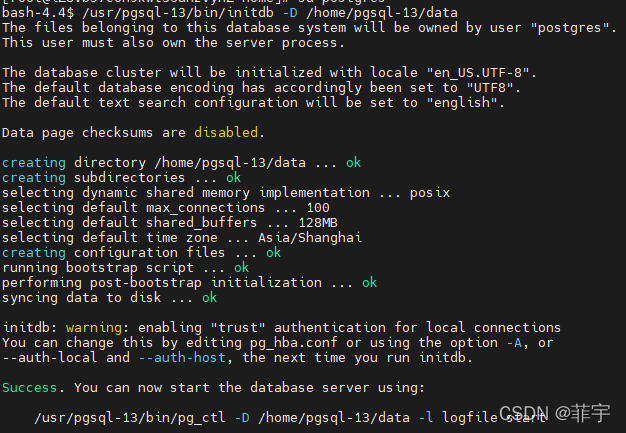
最近碰到这样一个SQL引发的性能问题,SQL内容大致如下: 1 2 3 4 5 6 7 SELECT * FROM t1 WHERE id = 999 AND (case $1 WHEN true THEN info = $2 ELSE info = $3 end) limit 1; 开发反应这条SQL加上limit 1之后过了一段时
|
最近碰到这样一个SQL引发的性能问题,SQL内容大致如下:
开发反应这条SQL加上limit 1之后过了一段时间从原先的索引扫描变成了全表扫描,一个简单的limit 1为何会产生这样的影响,我只取一条数据不是应该更快了吗? 下面我们就从这条SQL开始说起。 首先我们先看下这个表结构,比较简单,info列上有个索引,如下所示:
并且info列是没有重复值的,这意味着无论where条件中传入什么变量都肯定是能走索引扫描的。那为什么加上limit 1后会变成全表扫描呢? 我们先看看这条SQL之前正常的走索引的执行计划:
而现在的执行计划却是这样的:
奇怪的是下面的全表扫描加上limit后cost反而更低,但实际时间竟然长了这么多。而当我们将日志中获取的绑定变量值带入SQL中再去查看执行计划时,仍然是走索引扫描。既然如此,那比较容易想到的就是plan cache导致的执行计划错误了。 由于在PostgreSQL中执行计划缓存只是会话级别的,PostgreSQL在生成执行计划缓存前,会先走5次custom plan,然后记录这5次总的custom plan的cost, 以及custom plan的次数,最后生成通用的generic plan。 以后,每次bind时,会根据缓存的执行计划以及给定的参数值计算一个COST,如果这个COST 小于前面存储的custom plan cost的平均值,则使用当前缓存的执行计划。如果这个COST大于前面存储的custom plan cost的平均值,则使用custom plan(即重新生成执行计划),同时custom plan的次数加1,custom plan总成本也会累加进去。 既然如此,我们使用prepare语句再测试一次:
果然在第6次时出现了我们想要的结果! 可以看到前5次索引扫描的cost都是3.18,而全表扫描的cost却是0.35,所以自然优化器选择了全表扫描,可为什么cost变低了反而时间更久了呢?解答这个问题前我们先要来了解下limit子句的cost是如何计算的。 limit cost计算方法: 先从一个最简单的例子看起: 我们只取1条记录,cost很低,时间也很少。
加上where条件试试呢? cost一下子变成3703.39了,似乎也很好理解,因为我们在进行limit前要使用where条件进行一次数据过滤,所以cost变得很高了。
但当我们换个条件时结果又不同了: 从where id=1000变成 id=999,cost竟然一下子又降低到0.13了,似乎找到了前面全表扫描的limit cost比索引扫描还低的原因了。
那么这个limit的cost究竟是如何计算的呢,为什么条件不同cost能差这么多呢? 下面给出limit cost计算方法:
N:表示limit取的数据,如limit 1则N=1; B:表示估算得到的总记录数; A:表示估算的总成本。 例如上面cost=0.13的执行计划中,N = 1,B = 983582,A = 125915.11,那么limit cost便是: (1/983582)*125915.11 = 0.128,即执行计划中显示的0.13。 简而言之就是如果通过where条件筛选得到的行数越多,那么limit cost就会越低。 知道了这些我们再回过头去看那条SQL就清楚了,因为where id = 999这个条件的数据比较多,这也就导致了即使是全表扫描limit cost也很低,甚至比索引扫描还低。
但是需要注意的是,我们即使使用explain analyze看到的执行计划中的cost也是一个估算值,并不是实际值,尽管这个和实际值差距不会很大,但如果cost本身就很小,那么还是会带来一点误解的。 例如前面的SQL我想要提高全表扫描的limit cost让其大于索引扫描,这样优化器便会一直选择索引扫描了,于是我将limit 1改成limit 100(即增加N的值),但是却仍然没有起作用:
下面的全表扫描是第6次传入参数得到的,可以看到全表扫描的cost是8.9,而索引扫描是5.58,那应该不会选择cost更高的8.9啊? 而当我们去跟踪实际的cost就可以发现:
实际索引扫描的cost大约数10.58,和执行计划中显示的还是有一定差距的。 让我们言归正传,既然知道了为什么全表扫描的limit cost更低,我们再来解决下一个问题:为什么cost很低但实际执行时间却这么长? 让我们再看看执行计划:
仔细观察可以发现,原先应该作为索引的info列的过滤条件,竟然整个作为了filter条件去进行数据过滤了。 那么最后的问题就出现在这个where条件中的case when表达式了,因为在case when表达式进行过滤前,绑定变量还没有传入实际的值,而优化器对于不确定的值自然无法选择是否去走索引了,这里不得不吐槽一下这种写法。。。 因此对于优化器计算limit cost时,只知道where id = 999会得到大量的数据,而无法判断后面的case when里面会得到多少数据,因此虽然后面的条件只会得到很少一部分数据,但是优化器生成limit cost时估算得到的总记录数B只是根据id = 999去判断,导致估算的cost很低,但实际却只得到很少的数据,要去表中过滤大量数据。 不得不感叹这个“简单”的SQL竟然包含着这么多知识。 |


2022-02-26
2022-09-22
2022-09-18
2022-09-22
2022-08-26