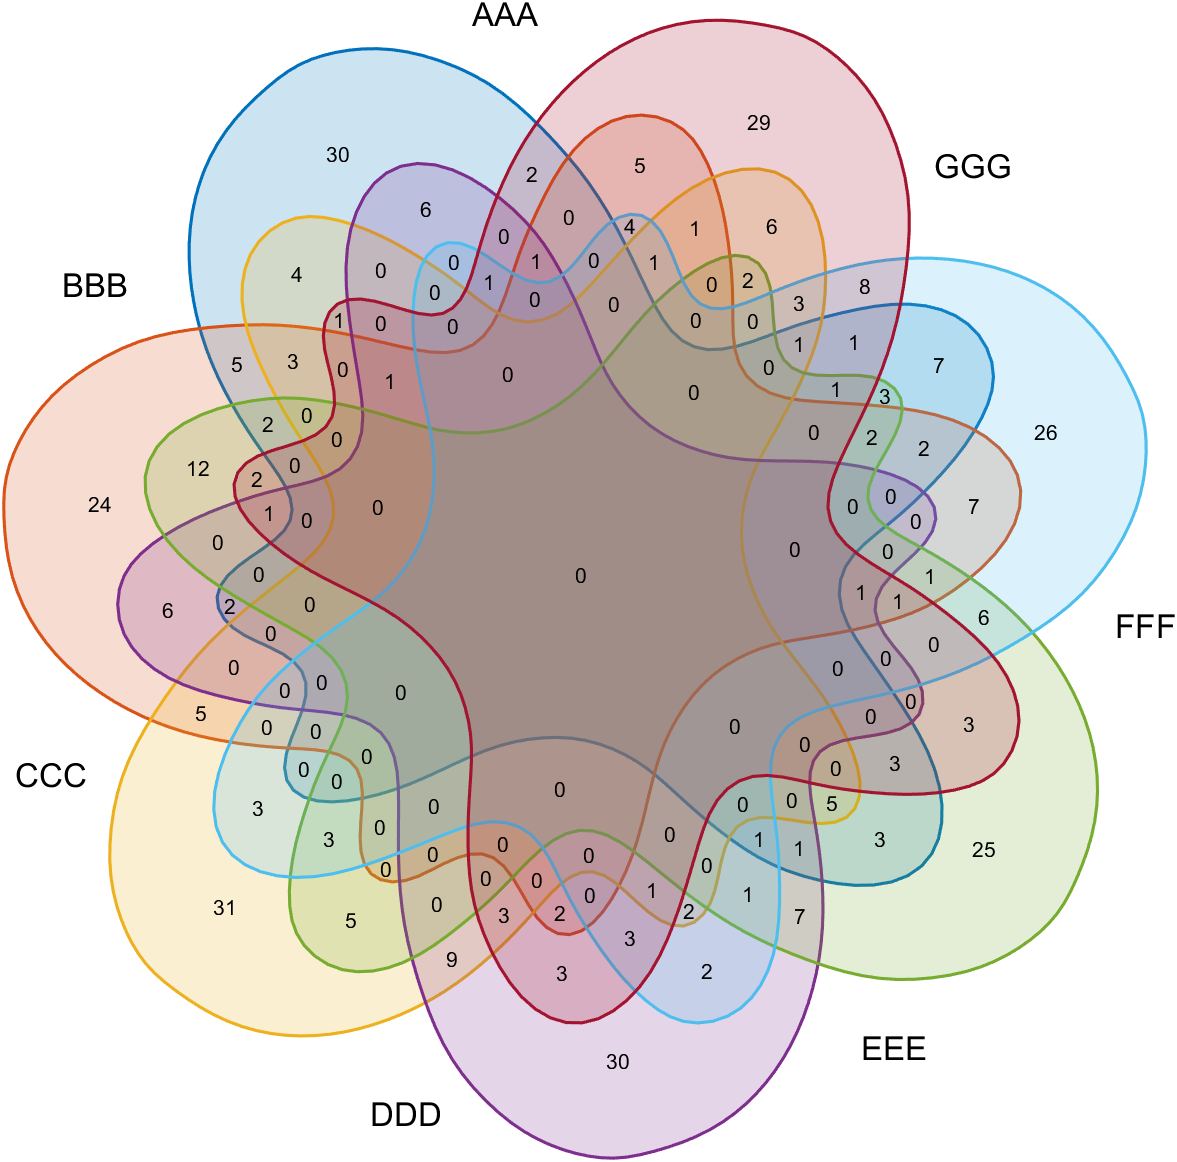
韦恩图随着阶数升高会越来越复杂,当阶数达到7或者以上时几乎没办法绘制:
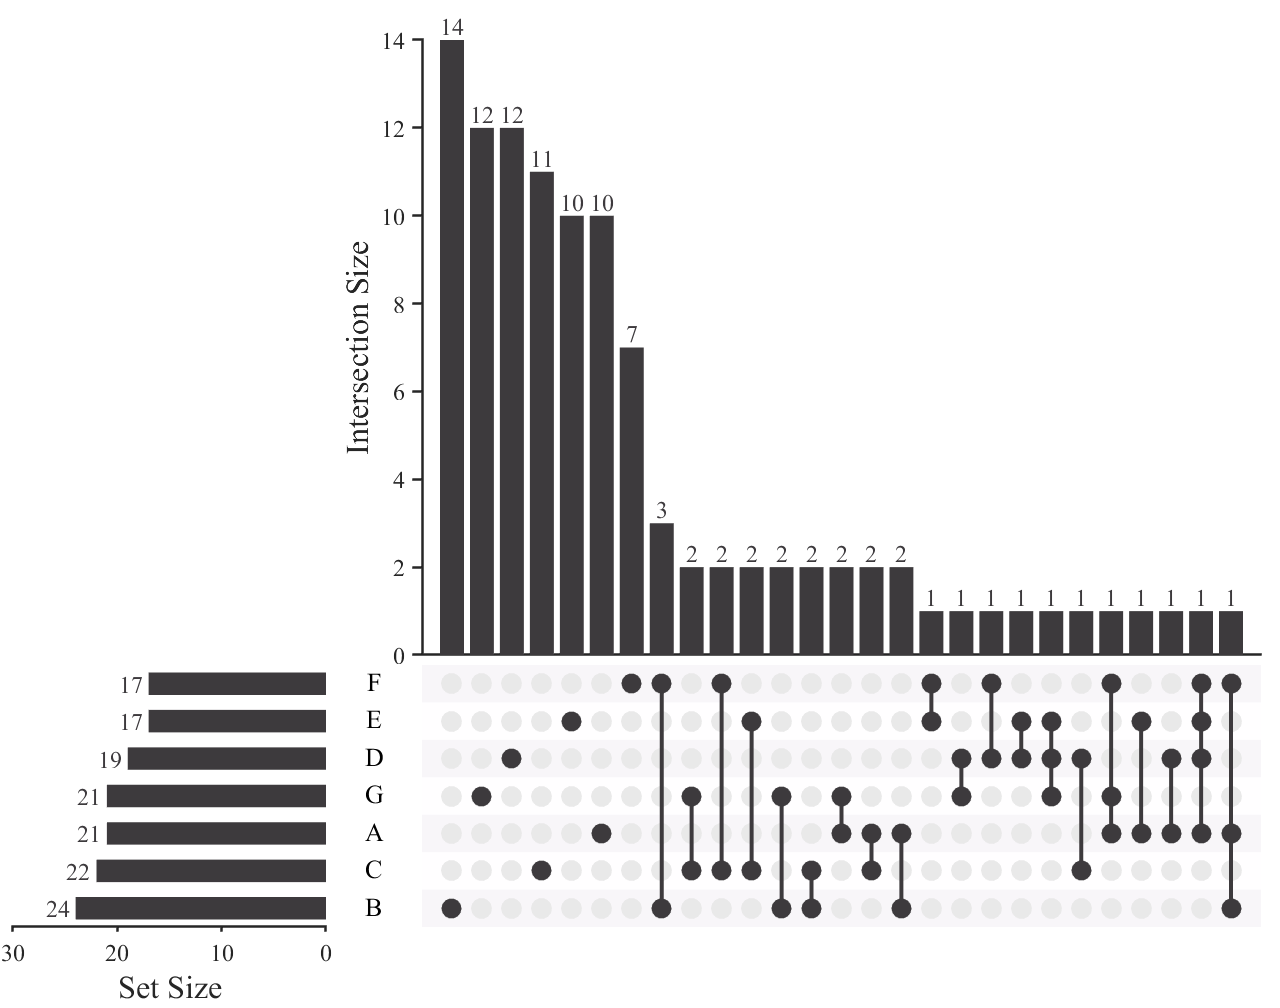
但是使用upset图却可以比较轻易的绘制:
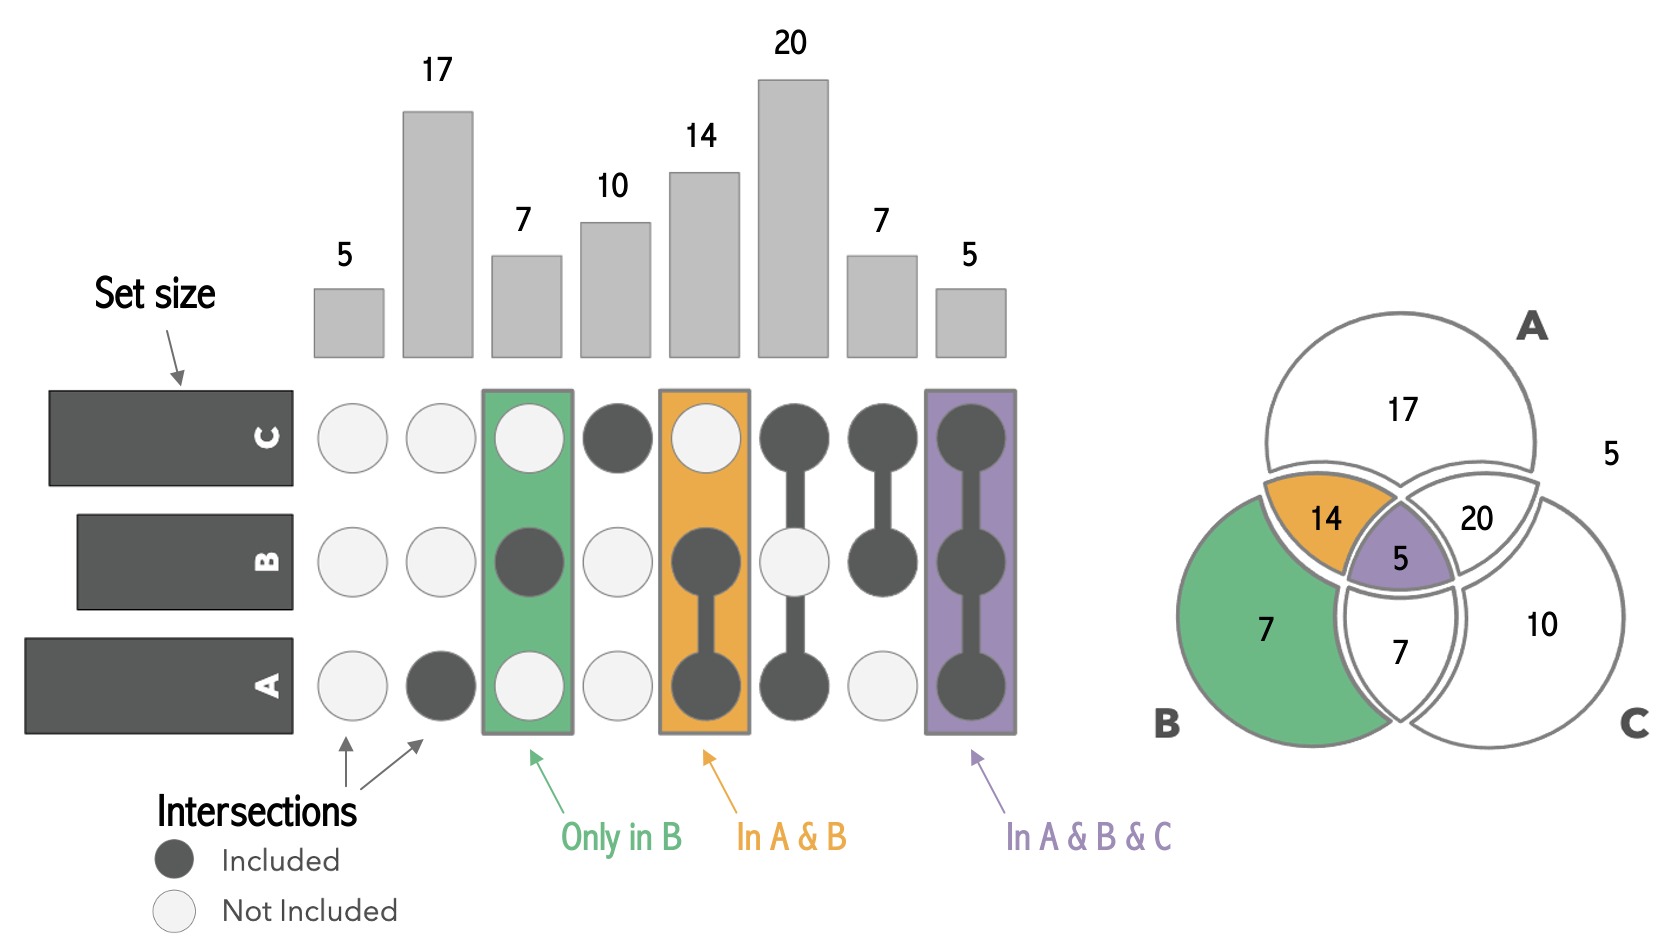
两种类型图的对应关系:
这期便教大家如何绘制这样的upset图:

教程部分
数据准备
数据需要的是0,1矩阵,例如随机生成数据:
|
1
2
|
setName={'RB1','PIK3R1','EGFR','TP53','PTEN'};
Data=rand([200,5])>.85;
|
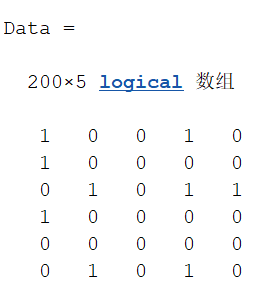
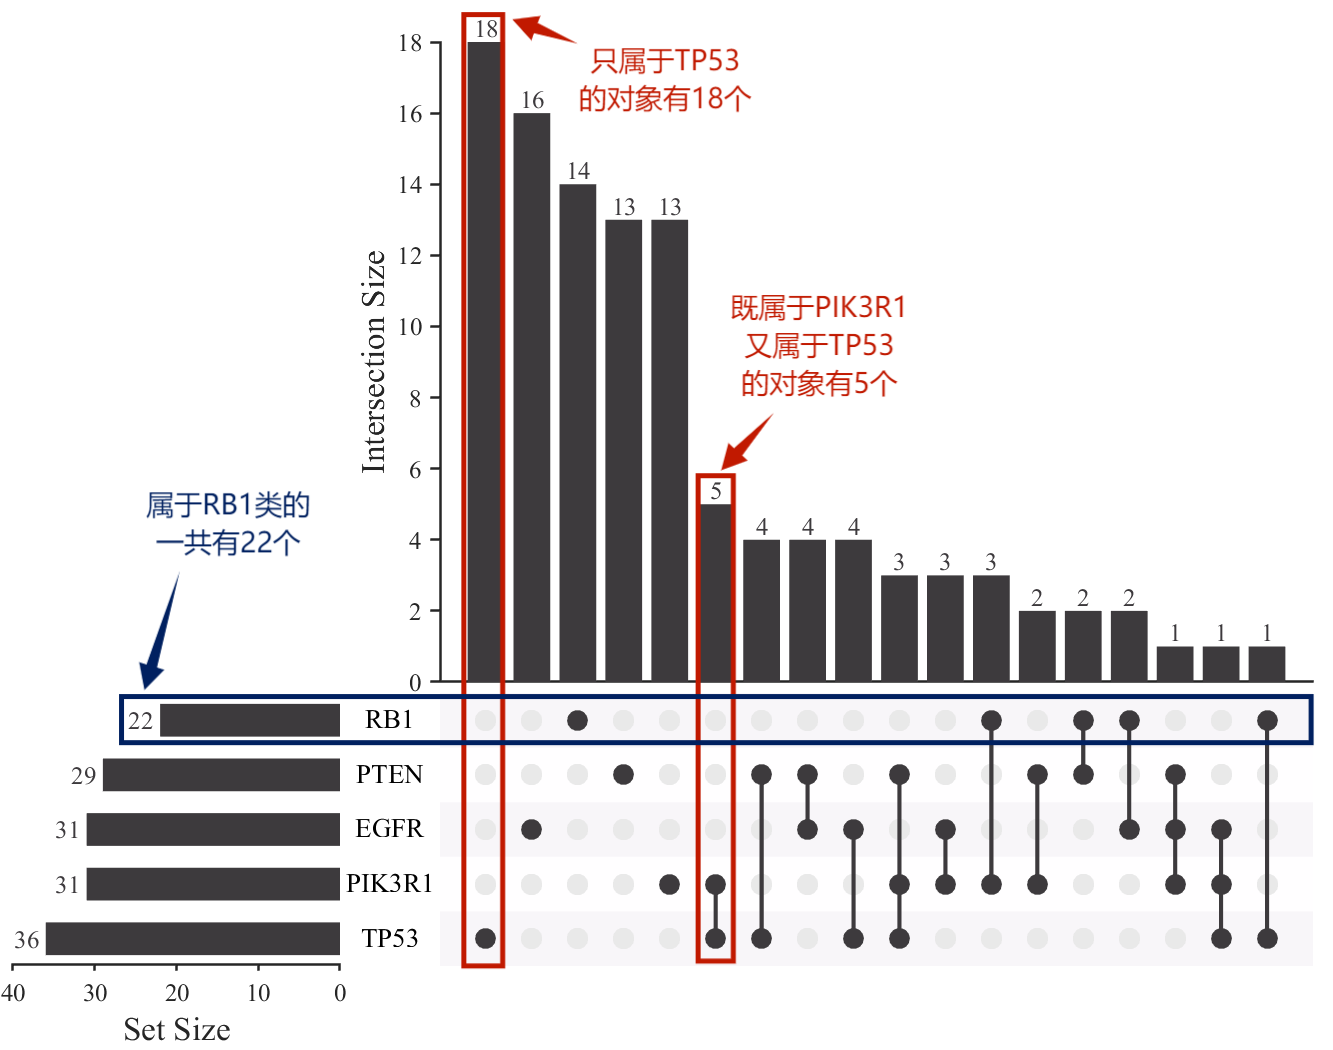
每一行代表一个对象,第一行是1,0,0,1,0说明它既属于第一类也属于第四类。
配色
配色可以是rgb数值,也可以是多行颜色,也可以用matlab自带的colormap数据:
|
1
2
3
4
|
% 设置两个柱状图及关系连线的颜色
bar1Color=[61,58,61]./255;
bar2Color=[61,58,61]./255;
lineColor=[61,58,61]./255;
|
在随后的部分会更详细的讲解颜色设置。
主要运算
接下来几行就是数据统计的详细代码,小技巧有点多,这部分技巧在韦恩图绘制那篇和数据统计那篇也写到过,可以去瞅瞅,这里不详细展开:
|
1
2
3
4
5
6
7
8
9
10
11
|
% 进行组合统计(一顿花里胡哨的操作)
pBool=abs(dec2bin((1:(2^size(Data,2)-1))'))-48;
[pPos,~]=find(((pBool*(1-Data'))|((1-pBool)*Data'))==0);
sPPos=sort(pPos);dPPos=find([diff(sPPos);1]);
pType=sPPos(dPPos);pCount=diff([0;dPPos]);
[pCount,pInd]=sort(pCount,'descend');
pType=pType(pInd);
sCount=sum(Data,1);
[sCount,sInd]=sort(sCount,'descend');
sType=1:size(Data,2);
sType=sType(sInd);
|
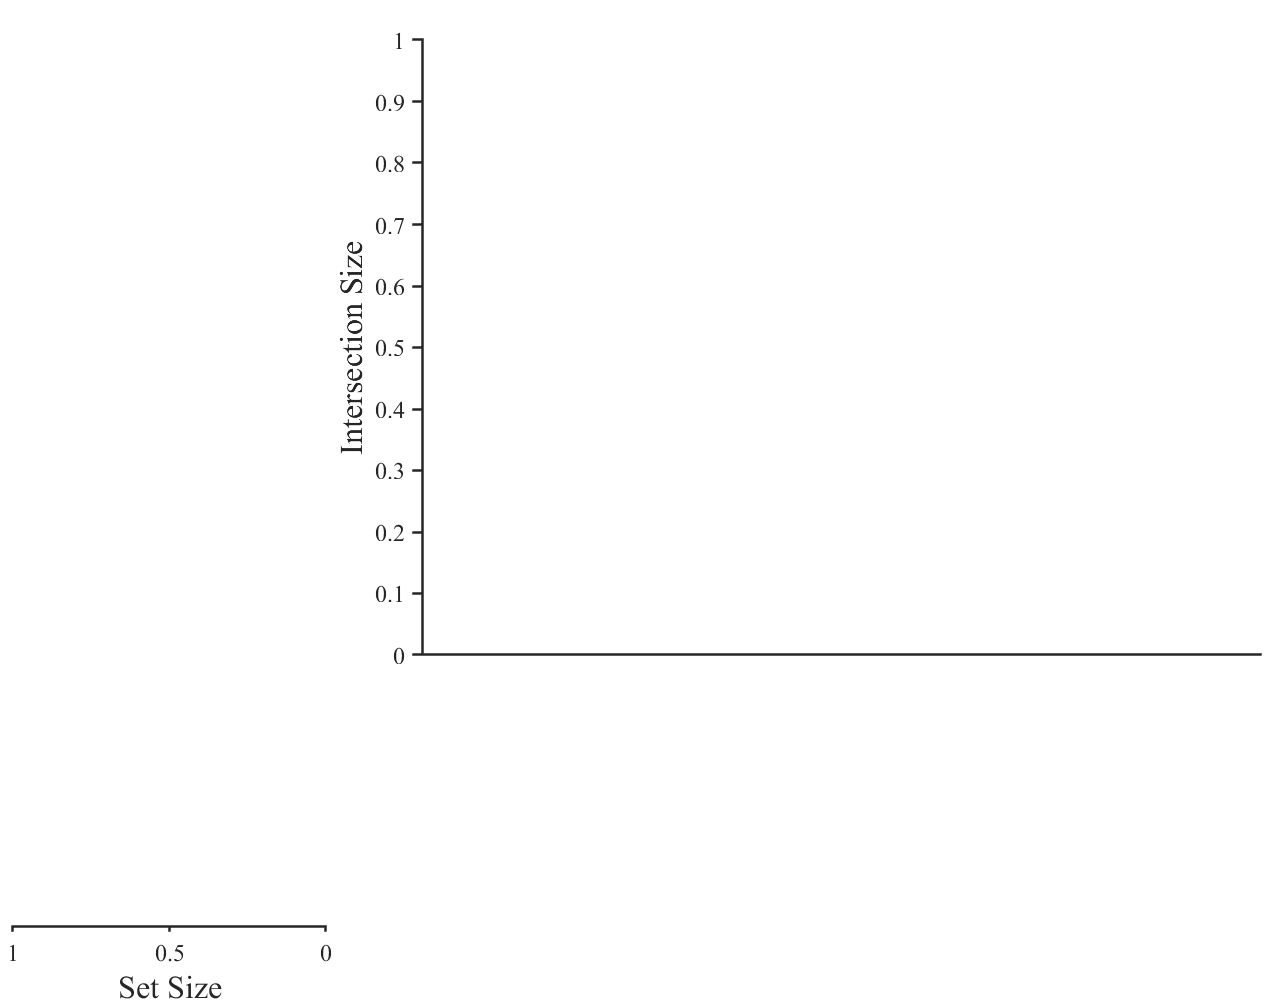
创建布局并修饰
若集合名称为中文乱码,请将字体改为宋体,若后面绘图部分显示不全请调整各个axes的XLim及YLim属性。
|
1
2
3
4
5
6
7
8
9
10
11
12
13
14
15
16
17
|
% 构造figure及axes
fig=figure('Units','normalized','Position',[.3,.2,.5,.63],'Color',[1,1,1]);
axI=axes('Parent',fig);hold on;
set(axI,'Position',[.33,.35,.655,.61],'LineWidth',1.2,'Box','off','TickDir','out',...
'FontName','Times New Roman','FontSize',12,'XTick',[],'XLim',[0,length(pType)+1])
axI.YLabel.String='Intersection Size';
axI.YLabel.FontSize=16;
%
axS=axes('Parent',fig);hold on;
set(axS,'Position',[.01,.08,.245,.26],'LineWidth',1.2,'Box','off','TickDir','out',...
'FontName','Times New Roman','FontSize',12,'YColor','none','YLim',[.5,size(Data,2)+.5],...
'YAxisLocation','right','XDir','reverse','YTick',[])
axS.XLabel.String='Set Size';
axS.XLabel.FontSize=16;
%
axL=axes('Parent',fig);hold on;
set(axL,'Position',[.33,.08,.655,.26],'YColor','none','YLim',[.5,size(Data,2)+.5],'XColor','none','XLim',axI.XLim)
|
图像绘制
|
1
2
3
4
5
6
7
8
9
10
11
12
13
14
15
16
17
18
19
20
21
22
23
24
25
26
27
28
29
30
31
32
33
34
35
36
37
38
39
40
41
42
43
44
45
46
47
48
49
50
51
52
53
54
55
56
57
58
59
|
% 相交关系统计图 -----------------------------------------------------------
barHdlI=bar(axI,pCount);
barHdlI.EdgeColor='none';
if size(bar1Color,1)==1
bar1Color=[bar1Color;bar1Color];
end
tx=linspace(0,1,size(bar1Color,1))';
ty1=bar1Color(:,1);ty2=bar1Color(:,2);ty3=bar1Color(:,3);
tX=linspace(0,1,length(pType))';
bar1Color=[interp1(tx,ty1,tX,'pchip'),interp1(tx,ty2,tX,'pchip'),interp1(tx,ty3,tX,'pchip')];
barHdlI.FaceColor='flat';
for i=1:length(pType)
barHdlI.CData(i,:)=bar1Color(i,:);
end
text(axI,1:length(pType),pCount,string(pCount),'HorizontalAlignment','center',...
'VerticalAlignment','bottom','FontName','Times New Roman','FontSize',12,'Color',[61,58,61]./255)
% 集合统计图 ---------------------------------------------------------------
barHdlS=barh(axS,sCount,'BarWidth',.6);
barHdlS.EdgeColor='none';
barHdlS.BaseLine.Color='none';
for i=1:size(Data,2)
annotation('textbox',[(axS.Position(1)+axS.Position(3)+axI.Position(1))/2-.02,...
axS.Position(2)+axS.Position(4)./size(Data,2).*(i-.5)-.02,.04,.04],...
'String',setName{sInd(i)},'HorizontalAlignment','center','VerticalAlignment','middle',...
'FitBoxToText','on','LineStyle','none','FontName','Times New Roman','FontSize',13)
end
if size(bar2Color,1)==1
bar2Color=[bar2Color;bar2Color];
end
tx=linspace(0,1,size(bar2Color,1))';
ty1=bar2Color(:,1);ty2=bar2Color(:,2);ty3=bar2Color(:,3);
tX=linspace(0,1,size(Data,2))';
bar2Color=[interp1(tx,ty1,tX,'pchip'),interp1(tx,ty2,tX,'pchip'),interp1(tx,ty3,tX,'pchip')];
barHdlS.FaceColor='flat';
sstr{size(Data,2)}='';
for i=1:size(Data,2)
barHdlS.CData(i,:)=bar2Color(i,:);
sstr{i}=[num2str(sCount(i)),' '];
end
text(axS,sCount,1:size(Data,2),sstr,'HorizontalAlignment','right',...
'VerticalAlignment','middle','FontName','Times New Roman','FontSize',12,'Color',[61,58,61]./255)
% 绘制关系连线 ---------------------------------------------------------------
patchColor=[248,246,249;255,254,255]./255;
for i=1:size(Data,2)
fill(axL,axI.XLim([1,2,2,1]),[-.5,-.5,.5,.5]+i,patchColor(mod(i+1,2)+1,:),'EdgeColor','none')
end
[tX,tY]=meshgrid(1:length(pType),1:size(Data,2));
plot(axL,tX(:),tY(:),'o','Color',[233,233,233]./255,...
'MarkerFaceColor',[233,233,233]./255,'MarkerSize',10);
for i=1:length(pType)
tY=find(pBool(pType(i),:));
oY=zeros(size(tY));
for j=1:length(tY)
oY(j)=find(sType==tY(j));
end
tX=i.*ones(size(tY));
plot(axL,tX(:),oY(:),'-o','Color',lineColor(1,:),'MarkerEdgeColor','none',...
'MarkerFaceColor',lineColor(1,:),'MarkerSize',10,'LineWidth',2);
end
|
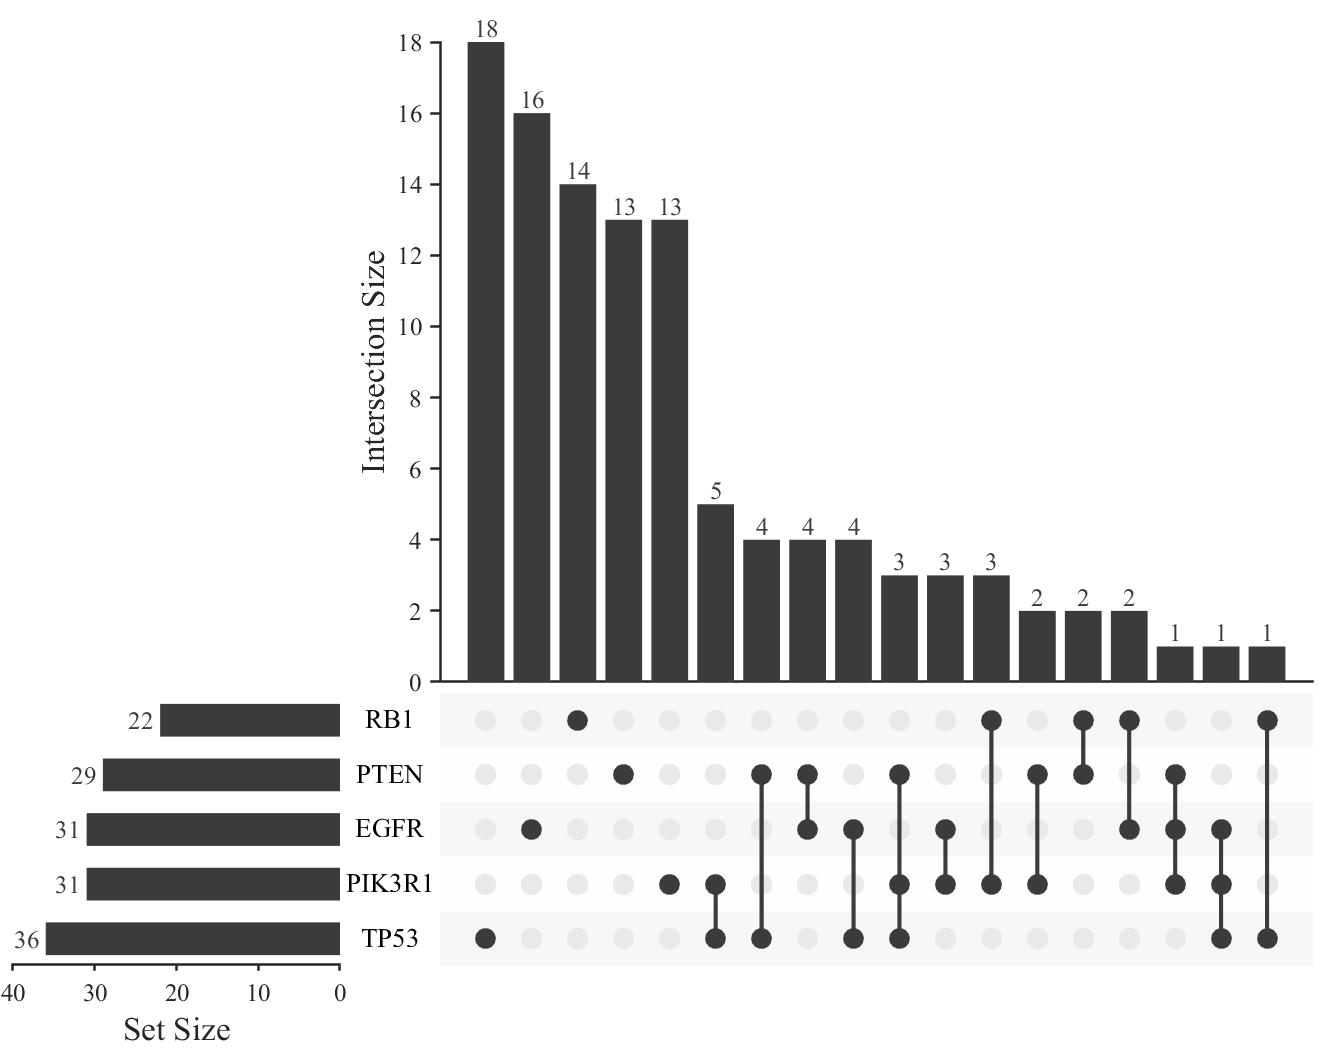
若是前面配色部分使用的是:
|
1
2
3
|
bar1Color=[61,58,61]./255;
bar2Color=[61,58,61]./255;
lineColor=[61,58,61]./255;
|
修改其中一个柱状图颜色,另一个用多行颜色矩阵:
|
1
2
3
4
5
6
7
|
bar1Color=[66,182,195]./255;
bar2Color=[253,255,228;
164,218,183;
68,181,197;
44,126,185;
35,51,154]./255;
lineColor=[61,58,61]./255;
|

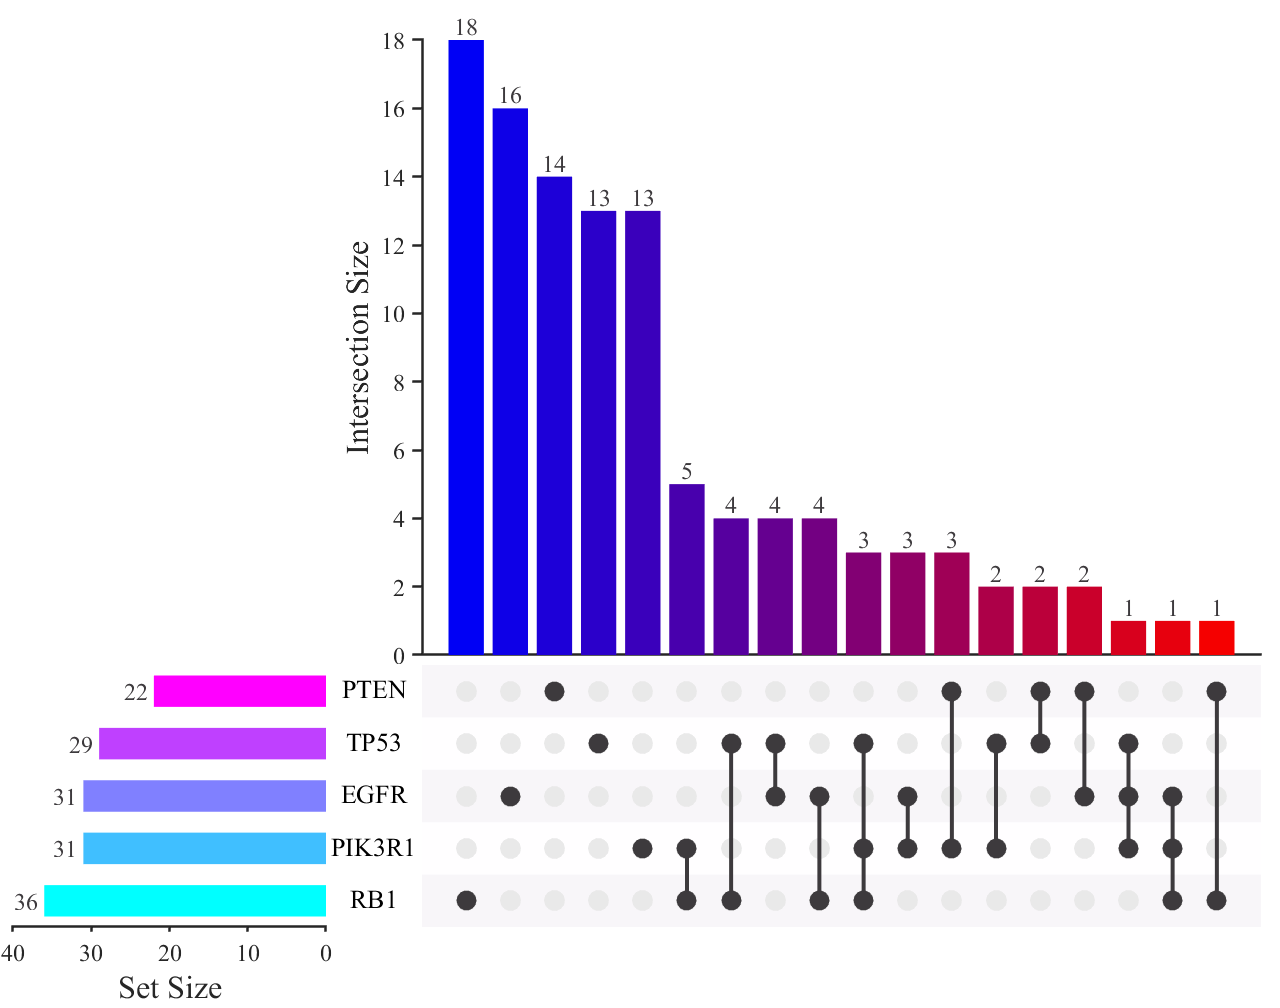
一个用多行颜色矩阵,一个使用自带colormap数据:
|
1
2
3
|
bar1Color=[0,0,245;245,0,0]./255;
bar2Color=cool;
lineColor=[61,58,61]./255;
|
完整代码
|
1
2
3
4
5
6
7
8
9
10
11
12
13
14
15
16
17
18
19
20
21
22
23
24
25
26
27
28
29
30
31
32
33
34
35
36
37
38
39
40
41
42
43
44
45
46
47
48
49
50
51
52
53
54
55
56
57
58
59
60
61
62
63
64
65
66
67
68
69
70
71
72
73
74
75
76
77
78
79
80
81
82
83
84
85
86
87
88
89
90
91
92
93
94
95
96
97
98
99
100
101
102
103
104
105
106
107
108
109
110
111
112
113
114
115
116
117
118
119
120
121
122
123
|
% upSetMDemo
% @author : slandarer
% Zhaoxu Liu / slandarer (2023). upset plot
% (https://www.mathworks.com/matlabcentral/fileexchange/123695-upset-plot),
% MATLAB Central File Exchange. 检索来源 2023/1/22.
rng(2)
clc;clear;
setName={'RB1','PIK3R1','EGFR','TP53','PTEN'};
Data=rand([200,5])>.85;
% setName={'A','B','C','D','E','F','G'};
% Data=rand([200,7])>.9;
% 设置两个柱状图及关系连线的颜色
bar1Color=[61,58,61]./255;
bar2Color=[61,58,61]./255;
lineColor=[61,58,61]./255;
% bar1Color=[66,182,195]./255;
% bar2Color=[253,255,228;
% 164,218,183;
% 68,181,197;
% 44,126,185;
% 35,51,154]./255;
% lineColor=[61,58,61]./255;
bar1Color=[0,0,245;245,0,0]./255;
bar2Color=cool;
lineColor=[61,58,61]./255;
%% =========================================================================
% 进行组合统计(一顿花里胡哨的操作)
pBool=abs(dec2bin((1:(2^size(Data,2)-1))'))-48;
[pPos,~]=find(((pBool*(1-Data'))|((1-pBool)*Data'))==0);
sPPos=sort(pPos);dPPos=find([diff(sPPos);1]);
pType=sPPos(dPPos);pCount=diff([0;dPPos]);
[pCount,pInd]=sort(pCount,'descend');
pType=pType(pInd);
sCount=sum(Data,1);
[sCount,sInd]=sort(sCount,'descend');
sType=1:size(Data,2);
sType=sType(sInd);
%% ========================================================================
% 构造figure及axes
fig=figure('Units','normalized','Position',[.3,.2,.5,.63],'Color',[1,1,1]);
axI=axes('Parent',fig);hold on;
set(axI,'Position',[.33,.35,.655,.61],'LineWidth',1.2,'Box','off','TickDir','out',...
'FontName','Times New Roman','FontSize',12,'XTick',[],'XLim',[0,length(pType)+1])
axI.YLabel.String='Intersection Size';
axI.YLabel.FontSize=16;
%
axS=axes('Parent',fig);hold on;
set(axS,'Position',[.01,.08,.245,.26],'LineWidth',1.2,'Box','off','TickDir','out',...
'FontName','Times New Roman','FontSize',12,'YColor','none','YLim',[.5,size(Data,2)+.5],...
'YAxisLocation','right','XDir','reverse','YTick',[])
axS.XLabel.String='Set Size';
axS.XLabel.FontSize=16;
%
axL=axes('Parent',fig);hold on;
set(axL,'Position',[.33,.08,.655,.26],'YColor','none','YLim',[.5,size(Data,2)+.5],'XColor','none','XLim',axI.XLim)
%% ========================================================================
% 相交关系统计图 -----------------------------------------------------------
barHdlI=bar(axI,pCount);
barHdlI.EdgeColor='none';
if size(bar1Color,1)==1
bar1Color=[bar1Color;bar1Color];
end
tx=linspace(0,1,size(bar1Color,1))';
ty1=bar1Color(:,1);ty2=bar1Color(:,2);ty3=bar1Color(:,3);
tX=linspace(0,1,length(pType))';
bar1Color=[interp1(tx,ty1,tX,'pchip'),interp1(tx,ty2,tX,'pchip'),interp1(tx,ty3,tX,'pchip')];
barHdlI.FaceColor='flat';
for i=1:length(pType)
barHdlI.CData(i,:)=bar1Color(i,:);
end
text(axI,1:length(pType),pCount,string(pCount),'HorizontalAlignment','center',...
'VerticalAlignment','bottom','FontName','Times New Roman','FontSize',12,'Color',[61,58,61]./255)
% 集合统计图 ---------------------------------------------------------------
barHdlS=barh(axS,sCount,'BarWidth',.6);
barHdlS.EdgeColor='none';
barHdlS.BaseLine.Color='none';
for i=1:size(Data,2)
annotation('textbox',[(axS.Position(1)+axS.Position(3)+axI.Position(1))/2-.02,...
axS.Position(2)+axS.Position(4)./size(Data,2).*(i-.5)-.02,.04,.04],...
'String',setName{sInd(i)},'HorizontalAlignment','center','VerticalAlignment','middle',...
'FitBoxToText','on','LineStyle','none','FontName','Times New Roman','FontSize',13)
end
if size(bar2Color,1)==1
bar2Color=[bar2Color;bar2Color];
end
tx=linspace(0,1,size(bar2Color,1))';
ty1=bar2Color(:,1);ty2=bar2Color(:,2);ty3=bar2Color(:,3);
tX=linspace(0,1,size(Data,2))';
bar2Color=[interp1(tx,ty1,tX,'pchip'),interp1(tx,ty2,tX,'pchip'),interp1(tx,ty3,tX,'pchip')];
barHdlS.FaceColor='flat';
sstr{size(Data,2)}='';
for i=1:size(Data,2)
barHdlS.CData(i,:)=bar2Color(i,:);
sstr{i}=[num2str(sCount(i)),' '];
end
text(axS,sCount,1:size(Data,2),sstr,'HorizontalAlignment','right',...
'VerticalAlignment','middle','FontName','Times New Roman','FontSize',12,'Color',[61,58,61]./255)
% 绘制关系连线 ---------------------------------------------------------------
patchColor=[248,246,249;255,254,255]./255;
for i=1:size(Data,2)
fill(axL,axI.XLim([1,2,2,1]),[-.5,-.5,.5,.5]+i,patchColor(mod(i+1,2)+1,:),'EdgeColor','none')
end
[tX,tY]=meshgrid(1:length(pType),1:size(Data,2));
plot(axL,tX(:),tY(:),'o','Color',[233,233,233]./255,...
'MarkerFaceColor',[233,233,233]./255,'MarkerSize',10);
for i=1:length(pType)
tY=find(pBool(pType(i),:));
oY=zeros(size(tY));
for j=1:length(tY)
oY(j)=find(sType==tY(j));
end
tX=i.*ones(size(tY));
plot(axL,tX(:),oY(:),'-o','Color',lineColor(1,:),'MarkerEdgeColor','none',...
'MarkerFaceColor',lineColor(1,:),'MarkerSize',10,'LineWidth',2);
end
% Zhaoxu Liu / slandarer (2023). upset plot
% (https://www.mathworks.com/matlabcentral/fileexchange/123695-upset-plot),
% MATLAB Central File Exchange. 检索来源 2023/1/22.
|
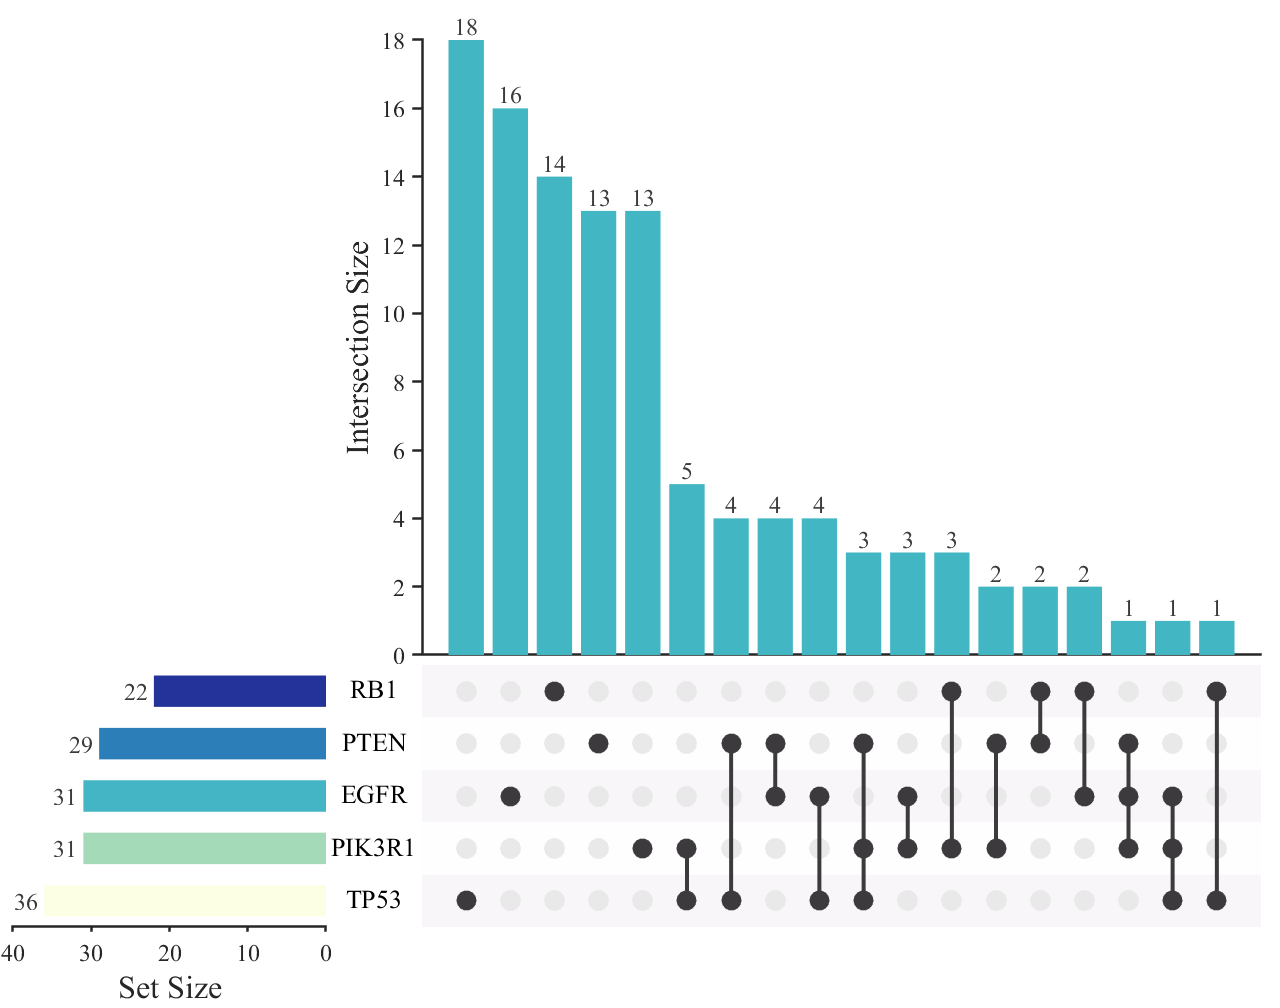
对于本例子的解读:
|